How are croaker and roe different? Croaker is richer in vitamin B3, while roe is higher in vitamin B12, vitamin B2, phosphorus, selenium, vitamin C, vitamin B1, and folate. Roe covers your daily need for vitamin B12, 393% more than croaker. Croaker contains 3 times more sodium than roe. Croaker contains 348mg of sodium, while roe contains 117mg. Roe has a higher glycemic index (27) than croaker (0). Fish, croaker, Atlantic, cooked, breaded, and fried and Fish, roe, mixed species, cooked, dry heat types were used in this article.
Infographic
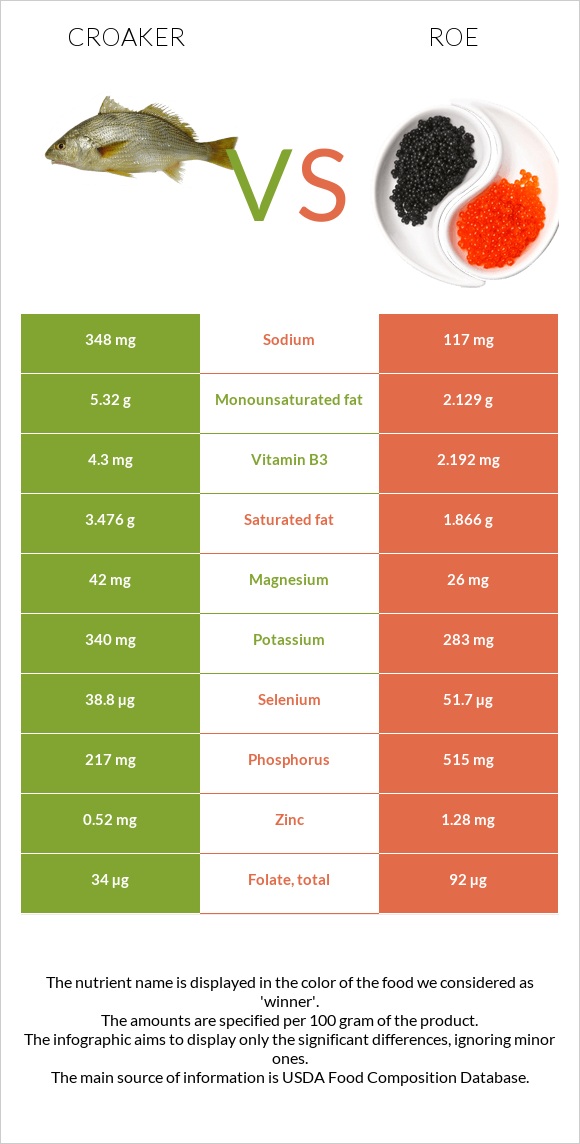
Mineral Comparison
Mineral comparison score is based on the number of minerals by which one or the other food is richer. The "coverage" charts below show how much of the daily needs can be covered by 300 grams of the food.
5
100 g
300 g
3 oz - 85g 1 fillet - 87g
Magnesium
Magnesium
Calcium
Calcium
Potassium
Potassium
Iron
Iron
Copper
Copper
Zinc
Zinc
Phosphorus
Phosphorus
Sodium
Sodium
Manganese
Manganese
Selenium
Selenium
30%
9.6%
30%
32%
22%
14%
93%
45%
10%
212%
5
100 g
300 g
1 oz - 28.35g 3 oz - 85g
Magnesium
Magnesium
Calcium
Calcium
Potassium
Potassium
Iron
Iron
Copper
Copper
Zinc
Zinc
Phosphorus
Phosphorus
Sodium
Sodium
Manganese
Manganese
Selenium
Selenium
19%
8.4%
25%
29%
43%
35%
221%
15%
1.7%
282%
Vitamin Comparison
Vitamin comparison score is based on the number of vitamins by which one or the other food is richer. The "coverage" charts below show how much of the daily needs can be covered by 300 grams of the food.
2
100 g
300 g
3 oz - 85g 1 fillet - 87g
Vitamin C
Vit. C
Vitamin D
Vit. D
Vitamin A
Vit. A
Vitamin E
Vit. E
Vitamin B1
Vit. B1
Vitamin B2
Vit. B2
Vitamin B3
Vit. B3
Vitamin B5
Vit. B5
Vitamin B6
Vit. B6
Vitamin B12
Vit. B12
Vitamin K
Vit. K
Folate
Folate
0%
0%
7.7%
0%
23%
30%
81%
44%
60%
263%
0%
26%
7
100 g
300 g
1 oz - 28.35g 3 oz - 85g
Vitamin C
Vit. C
Vitamin D
Vit. D
Vitamin A
Vit. A
Vitamin E
Vit. E
Vitamin B1
Vit. B1
Vitamin B2
Vit. B2
Vitamin B3
Vit. B3
Vitamin B5
Vit. B5
Vitamin B6
Vit. B6
Vitamin B12
Vit. B12
Vitamin K
Vit. K
Folate
Folate
55%
0%
30%
0%
69%
219%
41%
69%
43%
1443%
0%
69%
All nutrients comparison - raw data values
Nutrient
DV% diff.
Vitamin B12
2.1µg
11.54µg
393%
Cholesterol
84mg
479mg
132%
Vitamin B2
0.13mg
0.949mg
63%
Phosphorus
217mg
515mg
43%
Selenium
38.8µg
51.7µg
23%
Protein
18.2g
28.62g
21%
Vitamin C
0mg
16.4mg
18%
Vitamin B1
0.09mg
0.277mg
16%
Folate
34µg
92µg
15%
Vitamin B3
4.3mg
2.192mg
13%
Sodium
348mg
117mg
10%
Vitamin A
23µg
91µg
8%
Vitamin B5
0.74mg
1.154mg
8%
Monounsaturated fat
5.32g
2.129g
8%
Fats
12.67g
8.23g
7%
Copper
0.065mg
0.128mg
7%
Zinc
0.52mg
1.28mg
7%
Saturated fat
3.476g
1.866g
7%
Vitamin B6
0.26mg
0.185mg
6%
Magnesium
42mg
26mg
4%
Manganese
0.08mg
0.013mg
3%
Polyunsaturated fat
2.917g
3.404g
3%
Carbs
7.54g
1.92g
2%
Potassium
340mg
283mg
2%
Fiber
0.4g
0g
2%
Calories
221kcal
204kcal
1%
Iron
0.86mg
0.77mg
1%
Protein per 100 calories
8.2g
14g
N/A
Calories per 10 g protein
121kcal
71kcal
N/A
Weight per 100 calories
45g
49g
N/A
Unsaturated / Saturated Fat ratio
2.4
3
N/A
Net carbs
7.14g
1.92g
N/A
Calcium
32mg
28mg
0%
Tryptophan
0.208mg
0.375mg
0%
Threonine
0.788mg
1.305mg
0%
Isoleucine
0.847mg
1.465mg
0%
Leucine
1.48mg
2.509mg
0%
Lysine
1.571mg
2.179mg
0%
Methionine
0.525mg
0.71mg
0%
Phenylalanine
0.742mg
1.401mg
0%
Valine
0.947mg
1.676mg
0%
Histidine
0.525mg
0.778mg
0%
Omega-3 - EPA
0.113g
1.26g
N/A
Omega-3 - DHA
0.089g
1.747g
N/A
Omega-3 - DPA
0.079g
0.105g
N/A
Macronutrient Comparison
Macronutrient breakdown side-by-side comparison
3
18%
13%
8%
60%
2%
Protein:
18.2 g
Fats:
12.67 g
Carbs:
7.54 g
Water:
59.76 g
Other:
1.83 g
2
29%
8%
2%
59%
3%
Protein:
28.62 g
Fats:
8.23 g
Carbs:
1.92 g
Water:
58.63 g
Other:
2.6 g
Contains
more
Fats Fats
+53.9%
Contains
more
Carbs Carbs
+292.7%
Contains
more
Protein Protein
+57.3%
Contains
more
Other Other
+42.1%
Fat Type Comparison
Fat type breakdown side-by-side comparison
1
30%
45%
25%
Saturated fat:
Sat. Fat
3.476 g
Monounsaturated fat:
Mono. Fat
5.32 g
Polyunsaturated fat:
Poly. Fat
2.917 g
2
25%
29%
46%
Saturated fat:
Sat. Fat
1.866 g
Monounsaturated fat:
Mono. Fat
2.129 g
Polyunsaturated fat:
Poly. Fat
3.404 g
Contains
more
Mono. Fat Monounsaturated fat
+149.9%
Contains
less
Sat. Fat Saturated fat
-46.3%
Contains
more
Poly. Fat Polyunsaturated fat
+16.7%