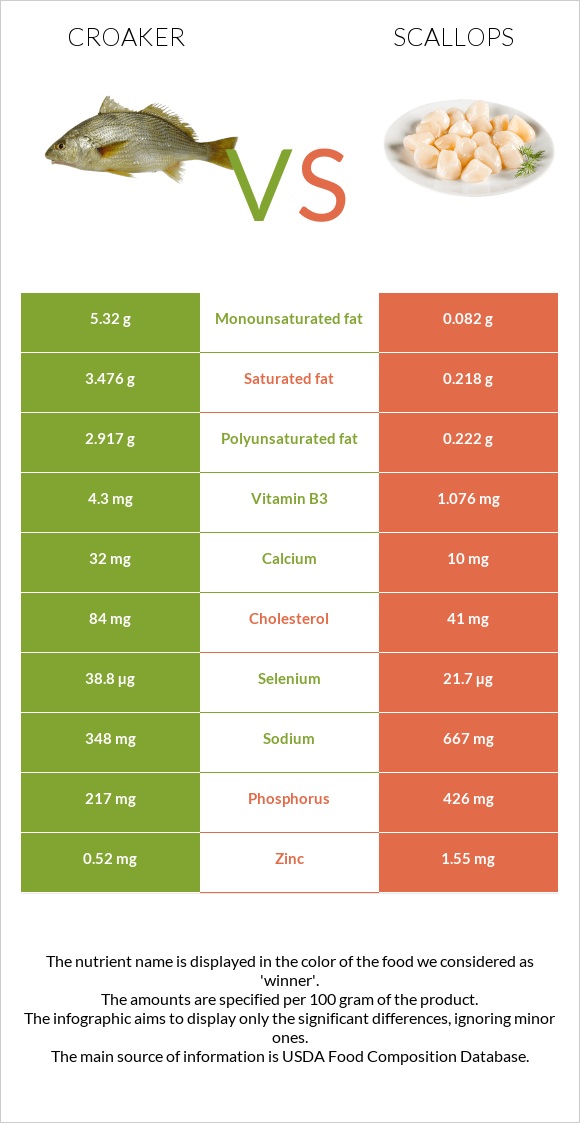
Differences between croaker and scallops Croaker is higher in selenium, vitamin B3, vitamin B6, vitamin B2, and vitamin B5; however, scallops are richer in phosphorus and zinc. Croaker's daily need coverage for selenium is 31% higher. Croaker has 16 times more saturated fat than scallops. While croaker has 3.476g of saturated fat, scallops have only 0.218g. The food types used in this comparison are Fish, croaker, Atlantic, cooked, breaded, and fried and Mollusks, scallop, (bay and sea), cooked, steamed .
Infographic
Mineral Comparison
Mineral comparison score is based on the number of minerals by which one or the other food is richer. The "coverage" charts below show how much of the daily needs can be covered by 300 grams of the food.
7
100 g
300 g
3 oz - 85g 1 fillet - 87g
Magnesium
Magnesium
Calcium
Calcium
Potassium
Potassium
Iron
Iron
Copper
Copper
Zinc
Zinc
Phosphorus
Phosphorus
Sodium
Sodium
Manganese
Manganese
Selenium
Selenium
30%
9.6%
30%
32%
22%
14%
93%
45%
10%
212%
2
100 g
300 g
3 oz - 85g
Magnesium
Magnesium
Calcium
Calcium
Potassium
Potassium
Iron
Iron
Copper
Copper
Zinc
Zinc
Phosphorus
Phosphorus
Sodium
Sodium
Manganese
Manganese
Selenium
Selenium
26%
3%
28%
22%
11%
42%
183%
87%
3.8%
118%
Vitamin Comparison
Vitamin comparison score is based on the number of vitamins by which one or the other food is richer. The "coverage" charts below show how much of the daily needs can be covered by 300 grams of the food.
7
100 g
300 g
3 oz - 85g 1 fillet - 87g
Vitamin C
Vit. C
Vitamin D
Vit. D
Vitamin A
Vit. A
Vitamin E
Vit. E
Vitamin B1
Vit. B1
Vitamin B2
Vit. B2
Vitamin B3
Vit. B3
Vitamin B5
Vit. B5
Vitamin B6
Vit. B6
Vitamin B12
Vit. B12
Vitamin K
Vit. K
Folate
Folate
0%
0%
7.7%
0%
23%
30%
81%
44%
60%
263%
0%
26%
0
100 g
300 g
3 oz - 85g
Vitamin C
Vit. C
Vitamin D
Vit. D
Vitamin A
Vit. A
Vitamin E
Vit. E
Vitamin B1
Vit. B1
Vitamin B2
Vit. B2
Vitamin B3
Vit. B3
Vitamin B5
Vit. B5
Vitamin B6
Vit. B6
Vitamin B12
Vit. B12
Vitamin K
Vit. K
Folate
Folate
0%
0%
0.67%
0%
3%
5.5%
20%
22%
26%
269%
0%
15%
All nutrients comparison - raw data values
Nutrient
DV% diff.
Selenium
38.8µg
21.7µg
31%
Phosphorus
217mg
426mg
30%
Vitamin B3
4.3mg
1.076mg
20%
Choline
110.7mg
20%
Fats
12.67g
0.84g
18%
Polyunsaturated fat
2.917g
0.222g
18%
Saturated fat
3.476g
0.218g
15%
Cholesterol
84mg
41mg
14%
Sodium
348mg
667mg
14%
Monounsaturated fat
5.32g
0.082g
13%
Vitamin B6
0.26mg
0.112mg
11%
Zinc
0.52mg
1.55mg
9%
Vitamin B2
0.13mg
0.024mg
8%
Vitamin B1
0.09mg
0.012mg
7%
Vitamin B5
0.74mg
0.366mg
7%
Calories
221kcal
111kcal
6%
Protein
18.2g
20.54g
5%
Iron
0.86mg
0.58mg
4%
Copper
0.065mg
0.033mg
4%
Folate
34µg
20µg
4%
Calcium
32mg
10mg
2%
Fiber
0.4g
0g
2%
Starch
3.69g
2%
Vitamin A
23µg
2µg
2%
Manganese
0.08mg
0.029mg
2%
Vitamin B12
2.1µg
2.15µg
2%
Carbs
7.54g
5.41g
1%
Magnesium
42mg
37mg
1%
Potassium
340mg
314mg
1%
Protein per 100 calories
8.2g
19g
N/A
Calories per 10 g protein
121kcal
54kcal
N/A
Weight per 100 calories
45g
90g
N/A
Unsaturated / Saturated Fat ratio
2.4
1.4
N/A
Net carbs
7.14g
5.41g
N/A
Vitamin D*
2 IU
0%
Trans fat
0.009g
N/A
Tryptophan
0.208mg
0.173mg
0%
Threonine
0.788mg
0.629mg
0%
Isoleucine
0.847mg
0.692mg
0%
Leucine
1.48mg
1.226mg
0%
Lysine
1.571mg
1.258mg
0%
Methionine
0.525mg
0.487mg
0%
Phenylalanine
0.742mg
0.597mg
0%
Valine
0.947mg
0.645mg
0%
Histidine
0.525mg
0.314mg
0%
Omega-3 - EPA
0.113g
0.072g
N/A
Omega-3 - DHA
0.089g
0.104g
N/A
Omega-3 - DPA
0.079g
0.005g
N/A
Omega-6 - Eicosadienoic acid
0.002g
N/A
Macronutrient Comparison
Macronutrient breakdown side-by-side comparison
2
18%
13%
8%
60%
2%
Protein:
18.2 g
Fats:
12.67 g
Carbs:
7.54 g
Water:
59.76 g
Other:
1.83 g
3
21%
5%
70%
3%
Protein:
20.54 g
Fats:
0.84 g
Carbs:
5.41 g
Water:
70.25 g
Other:
2.96 g
Contains
more
Fats Fats
+1408.3%
Contains
more
Carbs Carbs
+39.4%
Contains
more
Protein Protein
+12.9%
Contains
more
Water Water
+17.6%
Contains
more
Other Other
+61.7%
Fat Type Comparison
Fat type breakdown side-by-side comparison
2
30%
45%
25%
Saturated fat:
Sat. Fat
3.476 g
Monounsaturated fat:
Mono. Fat
5.32 g
Polyunsaturated fat:
Poly. Fat
2.917 g
1
42%
16%
43%
Saturated fat:
Sat. Fat
0.218 g
Monounsaturated fat:
Mono. Fat
0.082 g
Polyunsaturated fat:
Poly. Fat
0.222 g
Contains
more
Mono. Fat Monounsaturated fat
+6387.8%
Contains
more
Poly. Fat Polyunsaturated fat
+1214%
Contains
less
Sat. Fat Saturated fat
-93.7%