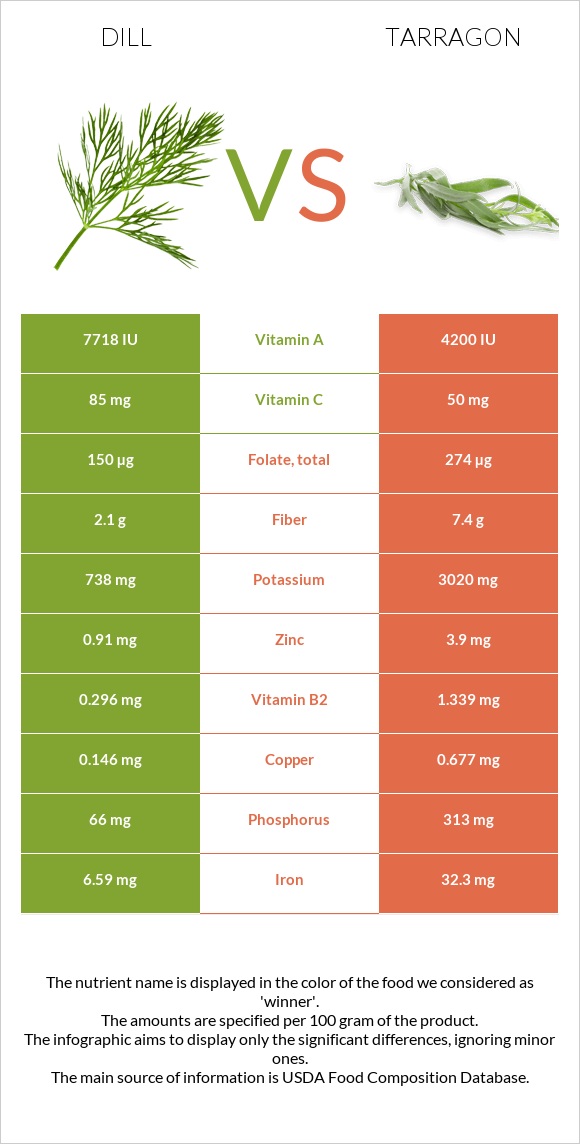
What are the main differences between dill and tarragon? Dill is richer in vitamin A, yet tarragon is richer in iron, manganese, vitamin B6, calcium, vitamin B2, magnesium, potassium, copper, and vitamin B3. Tarragon's daily need coverage for iron is 321% higher. Dill has 2 times more vitamin A than tarragon. Dill has 7718 IU of vitamin A, while tarragon has 4200 IU. Tarragon has a lower glycemic index than dill. We used Dill weed, fresh and Spices, tarragon, dried types in this comparison.
Infographic
Mineral Comparison
Mineral comparison score is based on the number of minerals by which one or the other food is richer. The "coverage" charts below show how much of the daily needs can be covered by 300 grams of the food.
0
100 g
300 g
5 sprigs - 1g 1 cup sprigs - 8.9g
Magnesium
Magnesium
Calcium
Calcium
Potassium
Potassium
Iron
Iron
Copper
Copper
Zinc
Zinc
Phosphorus
Phosphorus
Sodium
Sodium
Manganese
Manganese
Selenium
Selenium
39%
62%
65%
247%
49%
25%
28%
8%
165%
0%
9
100 g
300 g
0.25 tsp - 0.5g 1 tsp, ground - 1.6g 1 tbsp, leaves - 1.8g 1 tbsp, ground - 4.8g
Magnesium
Magnesium
Calcium
Calcium
Potassium
Potassium
Iron
Iron
Copper
Copper
Zinc
Zinc
Phosphorus
Phosphorus
Sodium
Sodium
Manganese
Manganese
Selenium
Selenium
248%
342%
266%
1211%
226%
106%
134%
8.1%
1039%
24%
Vitamin Comparison
Vitamin comparison score is based on the number of vitamins by which one or the other food is richer. The "coverage" charts below show how much of the daily needs can be covered by 300 grams of the food.
3
100 g
300 g
5 sprigs - 1g 1 cup sprigs - 8.9g
Vitamin C
Vit. C
Vitamin D
Vit. D
Vitamin A
Vit. A
Vitamin E
Vit. E
Vitamin B1
Vit. B1
Vitamin B2
Vit. B2
Vitamin B3
Vit. B3
Vitamin B5
Vit. B5
Vitamin B6
Vit. B6
Vitamin B12
Vit. B12
Vitamin K
Vit. K
Folate
Folate
283%
0%
129%
0%
15%
68%
29%
24%
43%
0%
0%
113%
5
100 g
300 g
0.25 tsp - 0.5g 1 tsp, ground - 1.6g 1 tbsp, leaves - 1.8g 1 tbsp, ground - 4.8g
Vitamin C
Vit. C
Vitamin D
Vit. D
Vitamin A
Vit. A
Vitamin E
Vit. E
Vitamin B1
Vit. B1
Vitamin B2
Vit. B2
Vitamin B3
Vit. B3
Vitamin B5
Vit. B5
Vitamin B6
Vit. B6
Vitamin B12
Vit. B12
Vitamin K
Vit. K
Folate
Folate
167%
0%
70%
0%
63%
309%
168%
0%
556%
0%
0%
206%
All nutrients comparison - raw data values
Nutrient
DV% diff.
Iron
6.59mg
32.3mg
321%
Manganese
1.264mg
7.967mg
291%
Vitamin B6
0.185mg
2.41mg
171%
Calcium
208mg
1139mg
93%
Vitamin B2
0.296mg
1.339mg
80%
Magnesium
55mg
347mg
70%
Potassium
738mg
3020mg
67%
Copper
0.146mg
0.677mg
59%
Vitamin B3
1.57mg
8.95mg
46%
Protein
3.46g
22.77g
39%
Vitamin C
85mg
50mg
39%
Phosphorus
66mg
313mg
35%
Folate
150µg
274µg
31%
Zinc
0.91mg
3.9mg
27%
Polyunsaturated fat
0.095g
3.698g
24%
Fiber
2.1g
7.4g
21%
Vitamin A
386µg
210µg
20%
Vitamin B1
0.058mg
0.251mg
16%
Carbs
7.02g
50.22g
14%
Calories
43kcal
295kcal
13%
Fats
1.12g
7.24g
9%
Selenium
4.4µg
8%
Vitamin B5
0.397mg
8%
Saturated fat
0.06g
1.881g
8%
Monounsaturated fat
0.802g
0.474g
1%
Protein per 100 calories
8g
7.7g
N/A
Calories per 10 g protein
124kcal
130kcal
N/A
Weight per 100 calories
233g
34g
N/A
Unsaturated / Saturated Fat ratio
15
2.2
N/A
Net carbs
4.92g
42.82g
N/A
Sodium
61mg
62mg
0%
Tryptophan
0.014mg
0%
Threonine
0.068mg
0%
Isoleucine
0.195mg
0%
Leucine
0.159mg
0%
Lysine
0.246mg
0%
Methionine
0.011mg
0%
Phenylalanine
0.065mg
0%
Valine
0.154mg
0%
Histidine
0.071mg
0%
Macronutrient Comparison
Macronutrient breakdown side-by-side comparison
1
3%
7%
86%
2%
Protein:
3.46 g
Fats:
1.12 g
Carbs:
7.02 g
Water:
85.95 g
Other:
2.45 g
4
23%
7%
50%
8%
12%
Protein:
22.77 g
Fats:
7.24 g
Carbs:
50.22 g
Water:
7.74 g
Other:
12.03 g
Contains
more
Water Water
+1010.5%
Contains
more
Protein Protein
+558.1%
Contains
more
Fats Fats
+546.4%
Contains
more
Carbs Carbs
+615.4%
Contains
more
Other Other
+391%
Fat Type Comparison
Fat type breakdown side-by-side comparison
2
6%
84%
10%
Saturated fat:
Sat. Fat
0.06 g
Monounsaturated fat:
Mono. Fat
0.802 g
Polyunsaturated fat:
Poly. Fat
0.095 g
1
31%
8%
61%
Saturated fat:
Sat. Fat
1.881 g
Monounsaturated fat:
Mono. Fat
0.474 g
Polyunsaturated fat:
Poly. Fat
3.698 g
Contains
less
Sat. Fat Saturated fat
-96.8%
Contains
more
Mono. Fat Monounsaturated fat
+69.2%
Contains
more
Poly. Fat Polyunsaturated fat
+3792.6%