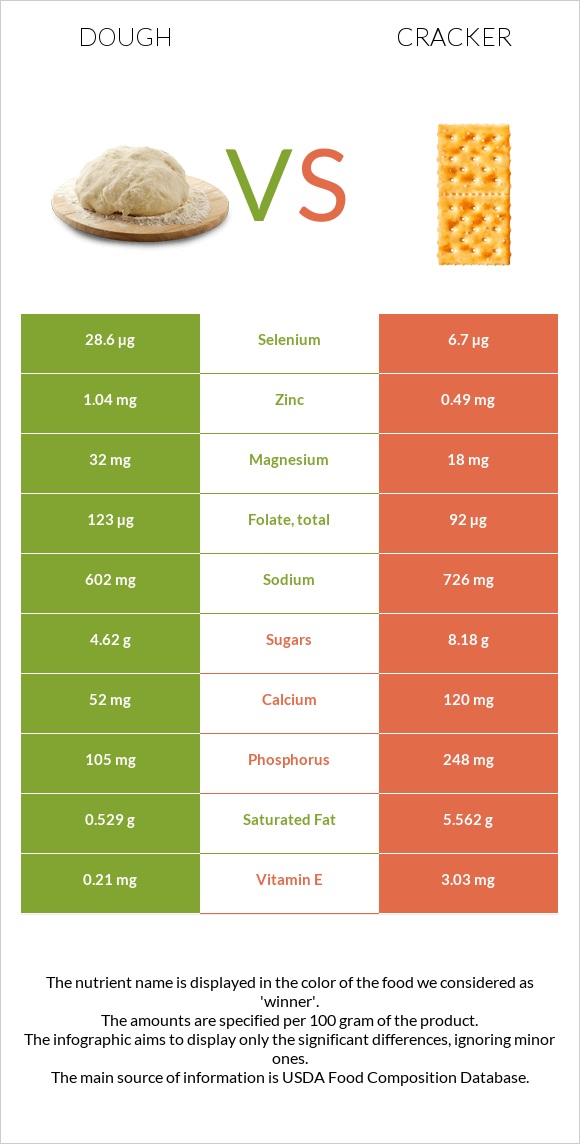
How are dough and crackers different? Dough has more selenium, vitamin B1, folate, and copper; however, crackers are richer in vitamin K, phosphorus, vitamin E, and calcium. Crackers cover your daily need for vitamin K, 57% more than dough. Dough has 4 times more selenium than crackers. Dough has 28.6µg of selenium, while crackers have 6.7µg. Dough contains less sodium. Bread, french or vienna (includes sourdough) and Crackers, standard snack-type, regular types were used in this article.
Infographic
Mineral Comparison
Mineral comparison score is based on the number of minerals by which one or the other food is richer. The "coverage" charts below show how much of the daily needs can be covered by 300 grams of the food.
6
100 g
300 g
1 oz - 28.35g 1 slice - 139g
Magnesium
Magnesium
Calcium
Calcium
Potassium
Potassium
Iron
Iron
Copper
Copper
Zinc
Zinc
Phosphorus
Phosphorus
Sodium
Sodium
Manganese
Manganese
Selenium
Selenium
23%
16%
10%
147%
51%
28%
45%
79%
75%
156%
2
100 g
300 g
1 cracker, round - 3.2g 1 cracker, rectangular - 4g 5 crackers - 16g 5 crackers, regular size, round (1 serving) - 16g 1 cup crushed - 52g
Magnesium
Magnesium
Calcium
Calcium
Potassium
Potassium
Iron
Iron
Copper
Copper
Zinc
Zinc
Phosphorus
Phosphorus
Sodium
Sodium
Manganese
Manganese
Selenium
Selenium
13%
36%
10%
151%
35%
13%
106%
95%
64%
37%
Vitamin Comparison
Vitamin comparison score is based on the number of vitamins by which one or the other food is richer. The "coverage" charts below show how much of the daily needs can be covered by 300 grams of the food.
3
100 g
300 g
1 oz - 28.35g 1 slice - 139g
Vitamin C
Vit. C
Vitamin D
Vit. D
Vitamin A
Vit. A
Vitamin E
Vit. E
Vitamin B1
Vit. B1
Vitamin B2
Vit. B2
Vitamin B3
Vit. B3
Vitamin B5
Vit. B5
Vitamin B6
Vit. B6
Vitamin B12
Vit. B12
Vitamin K
Vit. K
Folate
Folate
0%
0%
0%
4.2%
178%
99%
90%
27%
25%
0%
1.8%
92%
2
100 g
300 g
1 cracker, round - 3.2g 1 cracker, rectangular - 4g 5 crackers - 16g 5 crackers, regular size, round (1 serving) - 16g 1 cup crushed - 52g
Vitamin C
Vit. C
Vitamin D
Vit. D
Vitamin A
Vit. A
Vitamin E
Vit. E
Vitamin B1
Vit. B1
Vitamin B2
Vit. B2
Vitamin B3
Vit. B3
Vitamin B5
Vit. B5
Vitamin B6
Vit. B6
Vitamin B12
Vit. B12
Vitamin K
Vit. K
Folate
Folate
0%
0%
0%
61%
104%
105%
82%
25%
15%
0%
173%
69%
All nutrients comparison - raw data values
Nutrient
DV% diff.
Polyunsaturated fat
0.855g
13.137g
82%
Vitamin K
0.7µg
69.3µg
57%
Selenium
28.6µg
6.7µg
40%
Fats
2.42g
26.43g
37%
Vitamin B1
0.71mg
0.416mg
25%
Saturated fat
0.529g
5.562g
23%
Phosphorus
105mg
248mg
20%
Vitamin E
0.21mg
3.03mg
19%
Monounsaturated fat
0.362g
6.553g
15%
Calories
272kcal
510kcal
12%
Protein
10.75g
6.64g
8%
Folate
123µg
92µg
8%
Calcium
52mg
120mg
7%
Copper
0.152mg
0.104mg
5%
Zinc
1.04mg
0.49mg
5%
Sodium
602mg
726mg
5%
Manganese
0.577mg
0.491mg
4%
Carbs
51.88g
61.3g
3%
Magnesium
32mg
18mg
3%
Vitamin B3
4.817mg
4.352mg
3%
Vitamin B6
0.107mg
0.063mg
3%
Iron
3.91mg
4.03mg
2%
Starch
44.23g
49.69g
2%
Vitamin B2
0.427mg
0.456mg
2%
Vitamin B5
0.455mg
0.417mg
1%
Protein per 100 calories
4g
1.3g
N/A
Calories per 10 g protein
253kcal
768kcal
N/A
Weight per 100 calories
37g
20g
N/A
Unsaturated / Saturated Fat ratio
2.3
3.5
N/A
Net carbs
49.68g
59g
N/A
Potassium
117mg
118mg
0%
Sugar
4.62g
8.18g
N/A
Fiber
2.2g
2.3g
0%
Trans fat
0.005g
1.076g
N/A
Choline
8mg
9.6mg
0%
Tryptophan
0.084mg
0%
Threonine
0.193mg
0%
Isoleucine
0.246mg
0%
Leucine
0.471mg
0%
Lysine
0.103mg
0%
Methionine
0.112mg
0%
Phenylalanine
0.331mg
0%
Valine
0.294mg
0%
Histidine
0.145mg
0%
Fructose
0.51g
0.29g
0%
Omega-3 - ALA
0.063g
1.485g
N/A
Omega-6 - Gamma-linoleic acid
0.001g
0.062g
N/A
Omega-6 - Eicosadienoic acid
0g
0.009g
N/A
Omega-6 - Linoleic acid
0.788g
11.48g
N/A
Macronutrient Comparison
Macronutrient breakdown side-by-side comparison
2
11%
2%
52%
33%
2%
Protein:
10.75 g
Fats:
2.42 g
Carbs:
51.88 g
Water:
33 g
Other:
1.95 g
3
7%
26%
61%
3%
2%
Protein:
6.64 g
Fats:
26.43 g
Carbs:
61.3 g
Water:
3.14 g
Other:
2.49 g
Contains
more
Protein Protein
+61.9%
Contains
more
Water Water
+951%
Contains
more
Fats Fats
+992.1%
Contains
more
Carbs Carbs
+18.2%
Contains
more
Other Other
+27.7%
Fat Type Comparison
Fat type breakdown side-by-side comparison
1
30%
21%
49%
Saturated fat:
Sat. Fat
0.529 g
Monounsaturated fat:
Mono. Fat
0.362 g
Polyunsaturated fat:
Poly. Fat
0.855 g
2
22%
26%
52%
Saturated fat:
Sat. Fat
5.562 g
Monounsaturated fat:
Mono. Fat
6.553 g
Polyunsaturated fat:
Poly. Fat
13.137 g
Contains
less
Sat. Fat Saturated fat
-90.5%
Contains
more
Mono. Fat Monounsaturated fat
+1710.2%
Contains
more
Poly. Fat Polyunsaturated fat
+1436.5%
Carbohydrate type comparison
Carbohydrate type breakdown side-by-side comparison
2
91%
8%
Starch:
44.23 g
Sucrose:
0 g
Glucose:
0.4 g
Fructose:
0.51 g
Lactose:
0 g
Maltose:
3.7 g
Galactose:
0 g
3
86%
12%
Starch:
49.69 g
Sucrose:
6.95 g
Glucose:
0.47 g
Fructose:
0.29 g
Lactose:
0 g
Maltose:
0.48 g
Galactose:
0 g
Contains
more
Fructose Fructose
+75.9%
Contains
more
Maltose Maltose
+670.8%
Contains
more
Starch Starch
+12.3%
Contains
more
Sucrose Sucrose
+∞%
Contains
more
Glucose Glucose
+17.5%
~equal in
Lactose
~0g
~equal in
Galactose
~0g