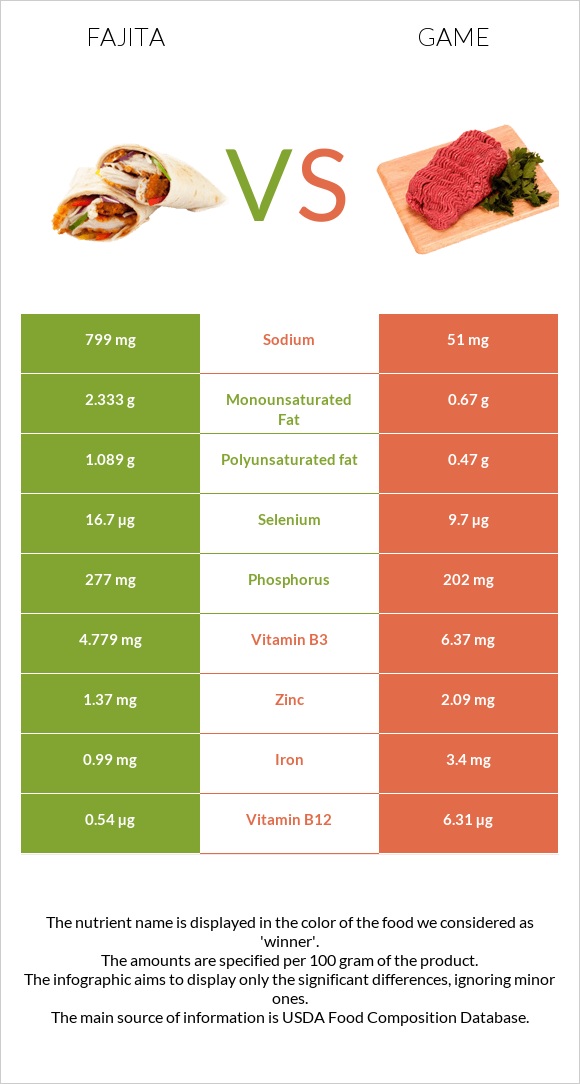
How are fajita and game different? Fajita is richer in phosphorus and selenium, while game is higher in iron, vitamin B2, copper, and vitamin B1. Game covers your daily need for iron, 40% more than fajita. Fajita contains 15 times more sodium than game. Fajita contains 799mg of sodium, while game contains 54mg. Fajita has a higher glycemic index (42) than game (0). USDA Commodity, chicken fajita strips, frozen and Game meat, antelope, cooked, roasted types were used in this article.
Infographic
Mineral Comparison
Mineral comparison score is based on the number of minerals by which one or the other food is richer. The "coverage" charts below show how much of the daily needs can be covered by 300 grams of the food.
4
100 g
300 g
1 strip - 9.4g
Magnesium
Magnesium
Calcium
Calcium
Potassium
Potassium
Iron
Iron
Copper
Copper
Zinc
Zinc
Phosphorus
Phosphorus
Sodium
Sodium
Manganese
Manganese
Selenium
Selenium
16%
3.9%
25%
37%
10%
37%
119%
104%
8.6%
91%
6
100 g
300 g
3 oz - 85g 1 piece, cooked (yield from 1 lb raw meat, boneless) - 340g
Magnesium
Magnesium
Calcium
Calcium
Potassium
Potassium
Iron
Iron
Copper
Copper
Zinc
Zinc
Phosphorus
Phosphorus
Sodium
Sodium
Manganese
Manganese
Selenium
Selenium
20%
1.2%
33%
158%
71%
46%
90%
7%
2.9%
70%
Vitamin Comparison
Vitamin comparison score is based on the number of vitamins by which one or the other food is richer. The "coverage" charts below show how much of the daily needs can be covered by 300 grams of the food.
6
100 g
300 g
1 strip - 9.4g
Vitamin C
Vit. C
Vitamin D
Vit. D
Vitamin A
Vit. A
Vitamin E
Vit. E
Vitamin B1
Vit. B1
Vitamin B2
Vit. B2
Vitamin B3
Vit. B3
Vitamin B5
Vit. B5
Vitamin B6
Vit. B6
Vitamin B12
Vit. B12
Vitamin K
Vit. K
Folate
Folate
0%
0%
0%
4.4%
25%
49%
90%
44%
89%
68%
0.5%
3%
3
100 g
300 g
3 oz - 85g 1 piece, cooked (yield from 1 lb raw meat, boneless) - 340g
Vitamin C
Vit. C
Vitamin D
Vit. D
Vitamin A
Vit. A
Vitamin E
Vit. E
Vitamin B1
Vit. B1
Vitamin B2
Vit. B2
Vitamin B3
Vit. B3
Vitamin B5
Vit. B5
Vitamin B6
Vit. B6
Vitamin B12
Vit. B12
Vitamin K
Vit. K
Folate
Folate
0%
0%
0%
0%
65%
168%
0%
0%
0%
0%
0%
6.8%
All nutrients comparison - raw data values
Nutrient
DV% diff.
Iron
0.99mg
4.2mg
40%
Vitamin B2
0.213mg
0.73mg
40%
Sodium
799mg
54mg
32%
Vitamin B3
4.779mg
30%
Vitamin B6
0.387mg
30%
Vitamin B12
0.54µg
23%
Protein
18.56g
29.45g
22%
Copper
0.03mg
0.213mg
20%
Vitamin B5
0.726mg
15%
Cholesterol
88mg
126mg
13%
Vitamin B1
0.1mg
0.26mg
13%
Choline
67.8mg
12%
Phosphorus
277mg
210mg
10%
Selenium
16.7µg
12.9µg
7%
Fats
5.73g
2.67g
5%
Monounsaturated fat
2.333g
0.63g
4%
Potassium
284mg
372mg
3%
Zinc
1.37mg
1.68mg
3%
Saturated fat
1.596g
0.97g
3%
Polyunsaturated fat
1.089g
0.58g
3%
Manganese
0.066mg
0.022mg
2%
Calories
135kcal
150kcal
1%
Carbs
2.23g
0g
1%
Magnesium
22mg
28mg
1%
Calcium
13mg
4mg
1%
Vitamin E
0.22mg
1%
Folate
4µg
9µg
1%
Protein per 100 calories
14g
20g
N/A
Calories per 10 g protein
73kcal
51kcal
N/A
Weight per 100 calories
74g
67g
N/A
Unsaturated / Saturated Fat ratio
2.1
1.2
N/A
Net carbs
2.23g
0g
N/A
Vitamin K
0.2µg
0%
Tryptophan
0.2mg
0%
Threonine
0.452mg
1.362mg
0%
Isoleucine
0.813mg
1.126mg
0%
Leucine
1.56mg
2.489mg
0%
Lysine
1.857mg
2.462mg
0%
Methionine
0.552mg
0.838mg
0%
Phenylalanine
0.763mg
1.166mg
0%
Valine
0.847mg
1.31mg
0%
Histidine
0.68mg
1.401mg
0%
Omega-3 - DPA
0.007g
N/A
Omega-6 - Eicosadienoic acid
0.01g
N/A
Macronutrient Comparison
Macronutrient breakdown side-by-side comparison
4
19%
6%
2%
71%
3%
Protein:
18.56 g
Fats:
5.73 g
Carbs:
2.23 g
Water:
70.6 g
Other:
2.88 g
1
29%
3%
66%
2%
Protein:
29.45 g
Fats:
2.67 g
Carbs:
0 g
Water:
65.9 g
Other:
1.98 g
Contains
more
Fats Fats
+114.6%
Contains
more
Carbs Carbs
+∞%
Contains
more
Other Other
+45.5%
Contains
more
Protein Protein
+58.7%
Fat Type Comparison
Fat type breakdown side-by-side comparison
2
32%
46%
22%
Saturated fat:
Sat. Fat
1.596 g
Monounsaturated fat:
Mono. Fat
2.333 g
Polyunsaturated fat:
Poly. Fat
1.089 g
1
44%
29%
27%
Saturated fat:
Sat. Fat
0.97 g
Monounsaturated fat:
Mono. Fat
0.63 g
Polyunsaturated fat:
Poly. Fat
0.58 g
Contains
more
Mono. Fat Monounsaturated fat
+270.3%
Contains
more
Poly. Fat Polyunsaturated fat
+87.8%
Contains
less
Sat. Fat Saturated fat
-39.2%