Sea bass vs. Grouper — In-Depth Nutrition Comparison
Compare
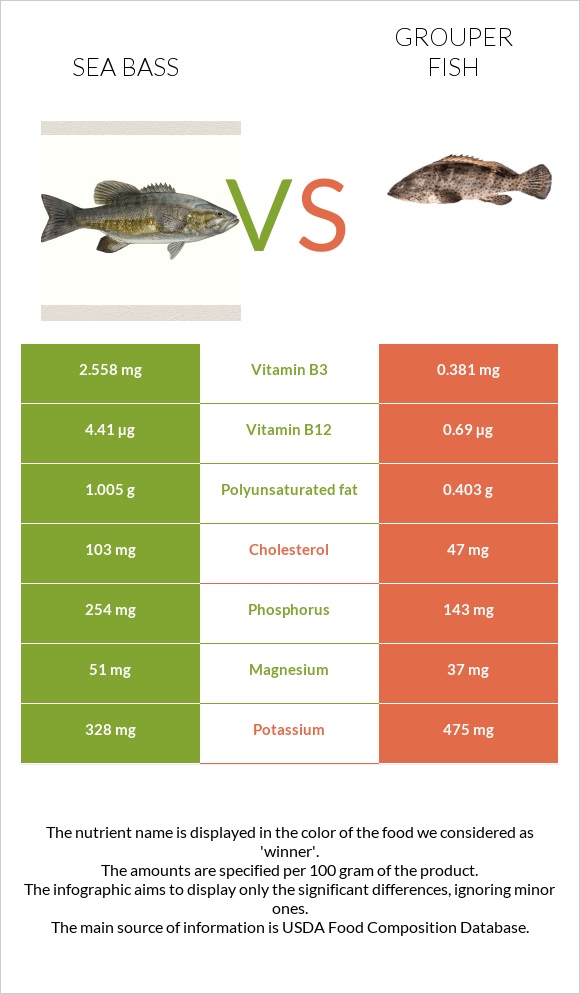
Significant differences between sea bass and grouper
- The amount of vitamin B12, phosphorus, vitamin B3, and polyunsaturated fat in sea bass is higher than in grouper.
- Sea bass covers your daily vitamin B12 needs 155% more than grouper.
- Grouper has 7 times less vitamin B3 than sea bass. Sea bass has 2.558mg of vitamin B3, while grouper has 0.381mg.
- Grouper contains less cholesterol.
Specific food types used in this comparison are Fish, bass, striped, cooked, dry heat and Fish, grouper, mixed species, cooked, dry heat.
Infographic
Infographic link
Mineral Comparison
Mineral comparison score is based on the number of minerals by which one or the other food is richer. The "coverage" charts below show how much of the daily needs can be covered by 300 grams of the food.
| Contains more MagnesiumMagnesium | +37.8% |
| Contains more PhosphorusPhosphorus | +77.6% |
| Contains more ManganeseManganese | +58.3% |
| Contains more CalciumCalcium | +10.5% |
| Contains more PotassiumPotassium | +44.8% |
| Contains more CopperCopper | +12.5% |
| Contains less SodiumSodium | -39.8% |
Vitamin Comparison
Vitamin comparison score is based on the number of vitamins by which one or the other food is richer. The "coverage" charts below show how much of the daily needs can be covered by 300 grams of the food.
| Contains more Vitamin B1Vitamin B1 | +42% |
| Contains more Vitamin B2Vitamin B2 | +516.7% |
| Contains more Vitamin B3Vitamin B3 | +571.4% |
| Contains more Vitamin B12Vitamin B12 | +539.1% |
| Contains more Vitamin AVitamin A | +61.3% |
All nutrients comparison - raw data values
| Nutrient |  |
 |
DV% diff. |
| Vitamin B12 | 4.41µg | 0.69µg | 155% |
| Cholesterol | 103mg | 47mg | 19% |
| Phosphorus | 254mg | 143mg | 16% |
| Vitamin B3 | 2.558mg | 0.381mg | 14% |
| Protein | 22.73g | 24.84g | 4% |
| Potassium | 328mg | 475mg | 4% |
| Polyunsaturated fat | 1.005g | 0.403g | 4% |
| Fats | 2.99g | 1.3g | 3% |
| Magnesium | 51mg | 37mg | 3% |
| Vitamin B1 | 0.115mg | 0.081mg | 3% |
| Sodium | 88mg | 53mg | 2% |
| Vitamin A | 31µg | 50µg | 2% |
| Vitamin B2 | 0.037mg | 0.006mg | 2% |
| Saturated fat | 0.65g | 0.299g | 2% |
| Iron | 1.08mg | 1.14mg | 1% |
| Copper | 0.04mg | 0.045mg | 1% |
| Monounsaturated fat | 0.846g | 0.268g | 1% |
| Calories | 124kcal | 118kcal | 0% |
| Protein per 100 calories | 18g | 21g | N/A |
| Calories per 10 g protein | 55kcal | 48kcal | N/A |
| Weight per 100 calories | 81g | 85g | N/A |
| Unsaturated / Saturated Fat ratio | 2.8 | 2.2 | N/A |
| Calcium | 19mg | 21mg | 0% |
| Zinc | 0.51mg | 0.51mg | 0% |
| Manganese | 0.019mg | 0.012mg | 0% |
| Selenium | 46.8µg | 46.8µg | 0% |
| Vitamin B5 | 0.865mg | 0.87mg | 0% |
| Vitamin B6 | 0.346mg | 0.35mg | 0% |
| Folate | 10µg | 10µg | 0% |
| Tryptophan | 0.255mg | 0.278mg | 0% |
| Threonine | 0.997mg | 1.089mg | 0% |
| Isoleucine | 1.047mg | 1.145mg | 0% |
| Leucine | 1.848mg | 2.019mg | 0% |
| Lysine | 2.088mg | 2.282mg | 0% |
| Methionine | 0.673mg | 0.735mg | 0% |
| Phenylalanine | 0.887mg | 0.97mg | 0% |
| Valine | 1.171mg | 1.28mg | 0% |
| Histidine | 0.669mg | 0.731mg | 0% |
| Omega-3 - EPA | 0.217g | 0.035g | N/A |
| Omega-3 - DHA | 0.75g | 0.213g | N/A |
| Omega-3 - DPA | 0.017g | N/A |
Macronutrient Comparison
Macronutrient breakdown side-by-side comparison
| Contains more FatsFats | +130% |
| Contains more OtherOther | +84% |
~equal in
Protein
~24.84g
~equal in
Carbs
~0g
~equal in
Water
~73.36g
Fat Type Comparison
Fat type breakdown side-by-side comparison
| Contains more Mono. FatMonounsaturated fat | +215.7% |
| Contains more Poly. FatPolyunsaturated fat | +149.4% |
| Contains less Sat. FatSaturated fat | -54% |


