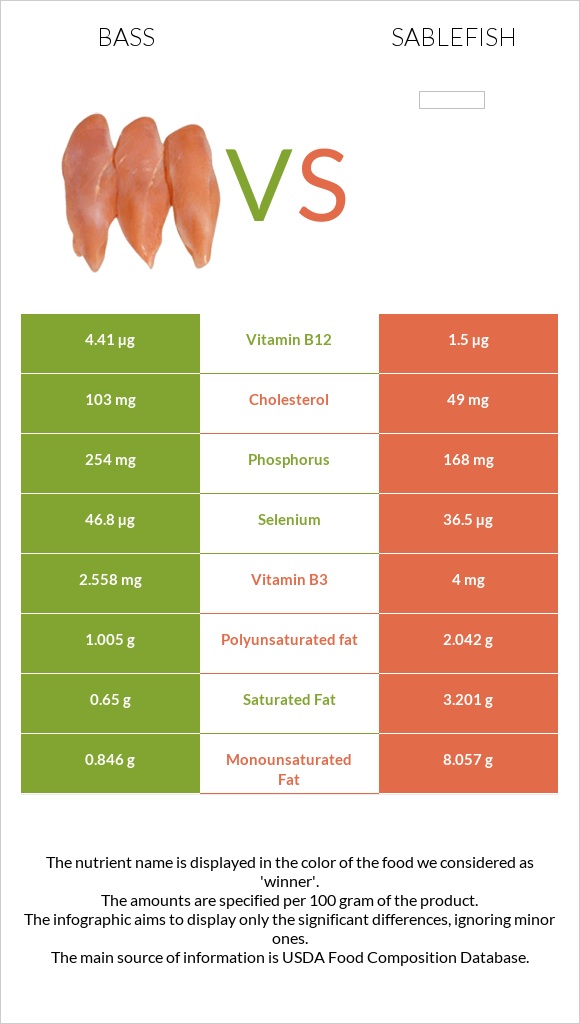
What are the main differences between sea bass and sablefish? Sea bass is richer in vitamin B12 and phosphorus, while sablefish is higher in vitamin B3, iron, and vitamin B2. Sea bass's daily need coverage for vitamin B12 is 124% higher. Sablefish has 2 times less cholesterol than sea bass. Sea bass has 103mg of cholesterol, while sablefish has 63mg. We used Fish, bass, striped, cooked, dry heat and Fish, sablefish, cooked, dry heat types in this comparison.
Infographic
Mineral Comparison
Mineral comparison score is based on the number of minerals by which one or the other food is richer. The "coverage" charts below show how much of the daily needs can be covered by 300 grams of the food.
3
100 g
300 g
3 oz - 85g 1 fillet - 124g
Magnesium
Magnesium
Calcium
Calcium
Potassium
Potassium
Iron
Iron
Copper
Copper
Zinc
Zinc
Phosphorus
Phosphorus
Sodium
Sodium
Manganese
Manganese
Selenium
Selenium
36%
5.7%
29%
41%
13%
14%
109%
11%
2.5%
255%
5
100 g
300 g
3 oz - 85g 0.5 fillet - 151g
Magnesium
Magnesium
Calcium
Calcium
Potassium
Potassium
Iron
Iron
Copper
Copper
Zinc
Zinc
Phosphorus
Phosphorus
Sodium
Sodium
Manganese
Manganese
Selenium
Selenium
51%
14%
41%
62%
9.3%
11%
92%
9.4%
2.5%
255%
Vitamin Comparison
Vitamin comparison score is based on the number of vitamins by which one or the other food is richer. The "coverage" charts below show how much of the daily needs can be covered by 300 grams of the food.
1
100 g
300 g
3 oz - 85g 1 fillet - 124g
Vitamin C
Vit. C
Vitamin D
Vit. D
Vitamin A
Vit. A
Vitamin E
Vit. E
Vitamin B1
Vit. B1
Vitamin B2
Vit. B2
Vitamin B3
Vit. B3
Vitamin B5
Vit. B5
Vitamin B6
Vit. B6
Vitamin B12
Vit. B12
Vitamin K
Vit. K
Folate
Folate
0%
0%
10%
0%
29%
8.5%
48%
52%
80%
551%
0%
7.5%
4
100 g
300 g
3 oz - 85g 0.5 fillet - 151g
Vitamin C
Vit. C
Vitamin D
Vit. D
Vitamin A
Vit. A
Vitamin E
Vit. E
Vitamin B1
Vit. B1
Vitamin B2
Vit. B2
Vitamin B3
Vit. B3
Vitamin B5
Vit. B5
Vitamin B6
Vit. B6
Vitamin B12
Vit. B12
Vitamin K
Vit. K
Folate
Folate
0%
0%
34%
0%
31%
27%
96%
52%
80%
180%
0%
13%
All nutrients comparison - raw data values
Nutrient
DV% diff.
Vitamin B12
4.41µg
1.44µg
124%
Fats
2.99g
19.62g
26%
Monounsaturated fat
0.846g
10.328g
24%
Vitamin B3
2.558mg
5.128mg
16%
Saturated fat
0.65g
4.099g
16%
Cholesterol
103mg
63mg
13%
Protein
22.73g
17.19g
11%
Polyunsaturated fat
1.005g
2.618g
11%
Vitamin A
31µg
102µg
8%
Iron
1.08mg
1.64mg
7%
Calories
124kcal
250kcal
6%
Phosphorus
254mg
215mg
6%
Vitamin B2
0.037mg
0.115mg
6%
Magnesium
51mg
71mg
5%
Potassium
328mg
459mg
4%
Calcium
19mg
45mg
3%
Folate
10µg
17µg
2%
Copper
0.04mg
0.028mg
1%
Zinc
0.51mg
0.41mg
1%
Sodium
88mg
72mg
1%
Vitamin B1
0.115mg
0.122mg
1%
Protein per 100 calories
18g
6.9g
N/A
Calories per 10 g protein
55kcal
145kcal
N/A
Weight per 100 calories
81g
40g
N/A
Unsaturated / Saturated Fat ratio
2.8
3.2
N/A
Manganese
0.019mg
0.019mg
0%
Selenium
46.8µg
46.8µg
0%
Vitamin B5
0.865mg
0.865mg
0%
Vitamin B6
0.346mg
0.346mg
0%
Tryptophan
0.255mg
0.193mg
0%
Threonine
0.997mg
0.754mg
0%
Isoleucine
1.047mg
0.792mg
0%
Leucine
1.848mg
1.397mg
0%
Lysine
2.088mg
1.579mg
0%
Methionine
0.673mg
0.509mg
0%
Phenylalanine
0.887mg
0.671mg
0%
Valine
1.171mg
0.886mg
0%
Histidine
0.669mg
0.506mg
0%
Omega-3 - EPA
0.217g
0.867g
N/A
Omega-3 - DHA
0.75g
0.92g
N/A
Omega-3 - DPA
0.216g
N/A
Macronutrient Comparison
Macronutrient breakdown side-by-side comparison
3
23%
3%
73%
Protein:
22.73 g
Fats:
2.99 g
Carbs:
0 g
Water:
73.36 g
Other:
0.92 g
1
17%
20%
63%
Protein:
17.19 g
Fats:
19.62 g
Carbs:
0 g
Water:
62.85 g
Other:
0.34 g
Contains
more
Protein Protein
+32.2%
Contains
more
Water Water
+16.7%
Contains
more
Other Other
+170.6%
Contains
more
Fats Fats
+556.2%
Fat Type Comparison
Fat type breakdown side-by-side comparison
1
26%
34%
40%
Saturated fat:
Sat. Fat
0.65 g
Monounsaturated fat:
Mono. Fat
0.846 g
Polyunsaturated fat:
Poly. Fat
1.005 g
2
24%
61%
15%
Saturated fat:
Sat. Fat
4.099 g
Monounsaturated fat:
Mono. Fat
10.328 g
Polyunsaturated fat:
Poly. Fat
2.618 g
Contains
less
Sat. Fat Saturated fat
-84.1%
Contains
more
Mono. Fat Monounsaturated fat
+1120.8%
Contains
more
Poly. Fat Polyunsaturated fat
+160.5%