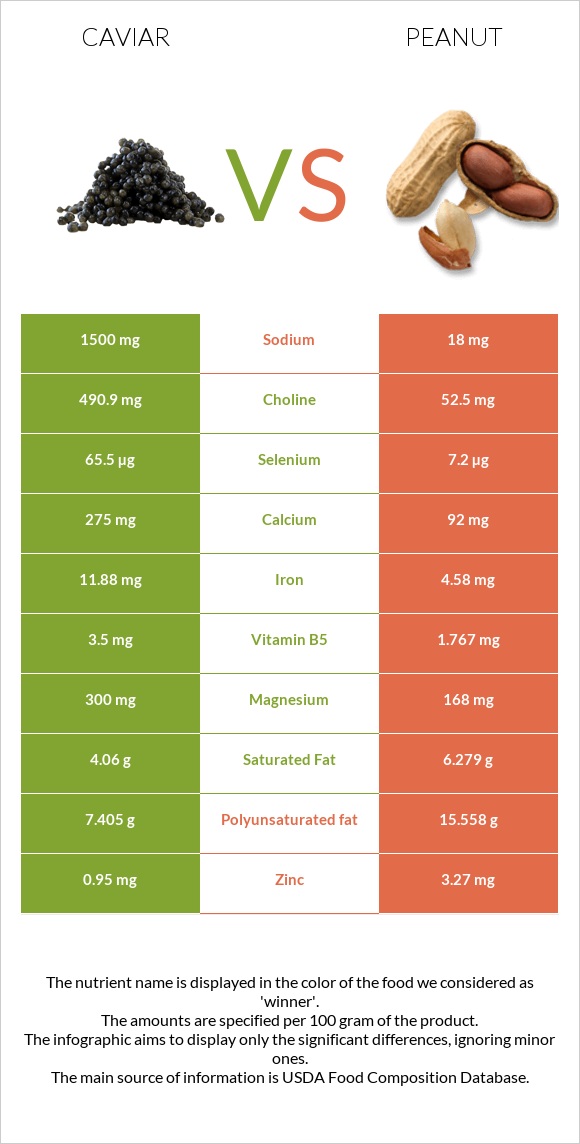
How are caviar and peanuts different? Caviar is higher in vitamin B12, selenium, iron, and choline; however, peanuts are richer in copper, manganese, vitamin B3, and folate. Daily need coverage for vitamin B12 for caviar is 833% higher. Caviar has a lower glycemic index (0) than peanuts (13). Fish, caviar, black, and red, granular and Peanuts, all types, raw are the varieties used in this article.
Infographic
Mineral Comparison
Mineral comparison score is based on the number of minerals by which one or the other food is richer. The "coverage" charts below show how much of the daily needs can be covered by 300 grams of the food.
4
100 g
300 g
1 tbsp - 16g 1 oz - 28.35g
Magnesium
Magnesium
Calcium
Calcium
Potassium
Potassium
Iron
Iron
Copper
Copper
Zinc
Zinc
Phosphorus
Phosphorus
Sodium
Sodium
Manganese
Manganese
Selenium
Selenium
214%
83%
16%
446%
37%
26%
153%
196%
6.5%
357%
5
100 g
300 g
1 oz - 28.35g 1 cup - 146g
Magnesium
Magnesium
Calcium
Calcium
Potassium
Potassium
Iron
Iron
Copper
Copper
Zinc
Zinc
Phosphorus
Phosphorus
Sodium
Sodium
Manganese
Manganese
Selenium
Selenium
120%
28%
62%
172%
381%
89%
161%
2.3%
252%
39%
Vitamin Comparison
Vitamin comparison score is based on the number of vitamins by which one or the other food is richer. The "coverage" charts below show how much of the daily needs can be covered by 300 grams of the food.
6
100 g
300 g
1 tbsp - 16g 1 oz - 28.35g
Vitamin C
Vit. C
Vitamin D
Vit. D
Vitamin A
Vit. A
Vitamin E
Vit. E
Vitamin B1
Vit. B1
Vitamin B2
Vit. B2
Vitamin B3
Vit. B3
Vitamin B5
Vit. B5
Vitamin B6
Vit. B6
Vitamin B12
Vit. B12
Vitamin K
Vit. K
Folate
Folate
0%
44%
90%
38%
48%
143%
2.3%
210%
74%
2500%
1.5%
38%
4
100 g
300 g
1 oz - 28.35g 1 cup - 146g
Vitamin C
Vit. C
Vitamin D
Vit. D
Vitamin A
Vit. A
Vitamin E
Vit. E
Vitamin B1
Vit. B1
Vitamin B2
Vit. B2
Vitamin B3
Vit. B3
Vitamin B5
Vit. B5
Vitamin B6
Vit. B6
Vitamin B12
Vit. B12
Vitamin K
Vit. K
Folate
Folate
0%
0%
0%
167%
160%
31%
226%
106%
80%
0%
0%
180%
All nutrients comparison - raw data values
Nutrient
DV% diff.
Vitamin B12
20µg
0µg
833%
Cholesterol
588mg
0mg
196%
Copper
0.11mg
1.144mg
115%
Selenium
65.5µg
7.2µg
106%
Iron
11.88mg
4.58mg
91%
Manganese
0.05mg
1.934mg
82%
Choline
490.9mg
52.5mg
80%
Vitamin B3
0.12mg
12.066mg
75%
Sodium
1500mg
18mg
64%
Polyunsaturated fat
7.405g
15.558g
54%
Monounsaturated fat
4.631g
24.426g
49%
Fats
17.9g
49.24g
48%
Folate
50µg
240µg
48%
Vitamin E
1.89mg
8.33mg
43%
Vitamin B1
0.19mg
0.64mg
38%
Vitamin B2
0.62mg
0.135mg
37%
Vitamin B5
3.5mg
1.767mg
35%
Fiber
0g
8.5g
34%
Magnesium
300mg
168mg
31%
Vitamin A
271µg
0µg
30%
Zinc
0.95mg
3.27mg
21%
Calcium
275mg
92mg
18%
Calories
264kcal
567kcal
15%
Vitamin D*
117 IU
0 IU
15%
Vitamin D
2.9µg
0µg
15%
Potassium
181mg
705mg
15%
Saturated fat
4.06g
6.279g
10%
Carbs
4g
16.13g
4%
Phosphorus
356mg
376mg
3%
Protein
24.6g
25.8g
2%
Vitamin B6
0.32mg
0.348mg
2%
Vitamin K
0.6µg
0µg
1%
Protein per 100 calories
9.3g
4.6g
N/A
Calories per 10 g protein
107kcal
220kcal
N/A
Weight per 100 calories
38g
18g
N/A
Unsaturated / Saturated Fat ratio
3
6.4
N/A
Net carbs
4g
7.63g
N/A
Sugar
0g
4.72g
N/A
Tryptophan
0.323mg
0.25mg
0%
Threonine
1.263mg
0.883mg
0%
Isoleucine
1.035mg
0.907mg
0%
Leucine
2.133mg
1.672mg
0%
Lysine
1.834mg
0.926mg
0%
Methionine
0.646mg
0.317mg
0%
Phenylalanine
1.071mg
1.377mg
0%
Valine
1.263mg
1.082mg
0%
Histidine
0.649mg
0.652mg
0%
Omega-3 - EPA
2.741g
0g
N/A
Omega-3 - DHA
3.8g
0g
N/A
Omega-3 - DPA
0.229g
0g
N/A
Macronutrient Comparison
Macronutrient breakdown side-by-side comparison
2
25%
18%
4%
48%
6%
Protein:
24.6 g
Fats:
17.9 g
Carbs:
4 g
Water:
47.5 g
Other:
6 g
3
26%
49%
16%
7%
2%
Protein:
25.8 g
Fats:
49.24 g
Carbs:
16.13 g
Water:
6.5 g
Other:
2.33 g
Contains
more
Water Water
+630.8%
Contains
more
Other Other
+157.5%
Contains
more
Fats Fats
+175.1%
Contains
more
Carbs Carbs
+303.3%
Fat Type Comparison
Fat type breakdown side-by-side comparison
1
25%
29%
46%
Saturated fat:
Sat. Fat
4.06 g
Monounsaturated fat:
Mono. Fat
4.631 g
Polyunsaturated fat:
Poly. Fat
7.405 g
2
14%
53%
34%
Saturated fat:
Sat. Fat
6.279 g
Monounsaturated fat:
Mono. Fat
24.426 g
Polyunsaturated fat:
Poly. Fat
15.558 g
Contains
less
Sat. Fat Saturated fat
-35.3%
Contains
more
Mono. Fat Monounsaturated fat
+427.4%
Contains
more
Poly. Fat Polyunsaturated fat
+110.1%