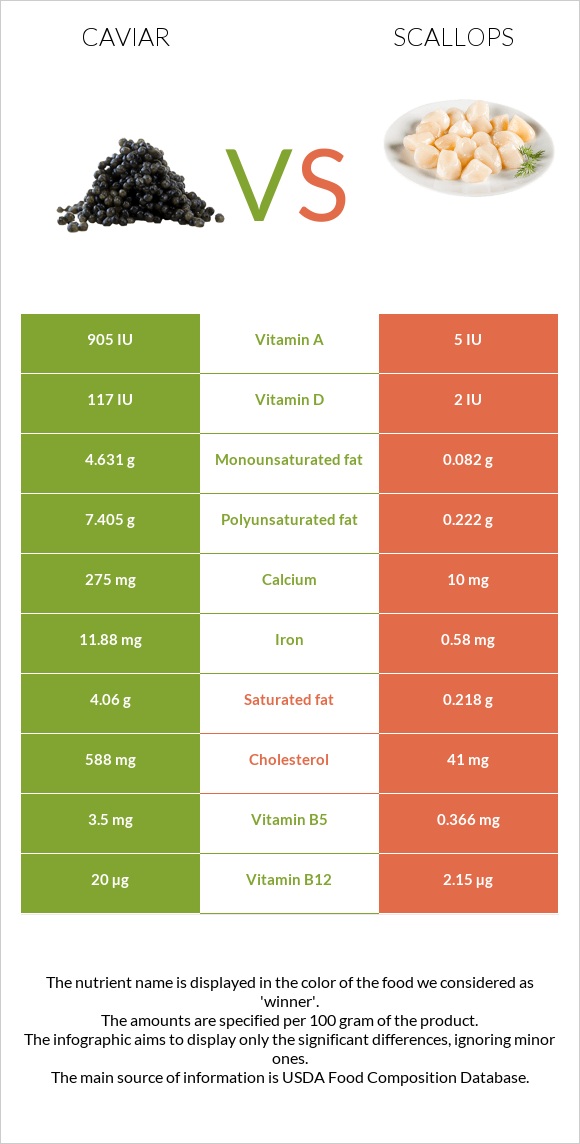
Important differences between caviar and scallops Caviar has more vitamin B12, iron, selenium, choline, vitamin B5, magnesium, vitamin B2, and calcium than scallops. Caviar's daily need coverage for vitamin B12 is 744% more. Caviar contains 28 times more calcium than scallops. Caviar contains 275mg of calcium, while scallops contain 10mg. Scallops contain less cholesterol. The food varieties used in the comparison are Fish, caviar, black, and red, granular and Mollusks, scallop, (bay and sea), cooked, steamed .
Infographic
Mineral Comparison
Mineral comparison score is based on the number of minerals by which one or the other food is richer. The "coverage" charts below show how much of the daily needs can be covered by 300 grams of the food.
6
100 g
300 g
1 tbsp - 16g 1 oz - 28.35g
Magnesium
Magnesium
Calcium
Calcium
Potassium
Potassium
Iron
Iron
Copper
Copper
Zinc
Zinc
Phosphorus
Phosphorus
Sodium
Sodium
Manganese
Manganese
Selenium
Selenium
214%
83%
16%
446%
37%
26%
153%
196%
6.5%
357%
4
100 g
300 g
3 oz - 85g
Magnesium
Magnesium
Calcium
Calcium
Potassium
Potassium
Iron
Iron
Copper
Copper
Zinc
Zinc
Phosphorus
Phosphorus
Sodium
Sodium
Manganese
Manganese
Selenium
Selenium
26%
3%
28%
22%
11%
42%
183%
87%
3.8%
118%
Vitamin Comparison
Vitamin comparison score is based on the number of vitamins by which one or the other food is richer. The "coverage" charts below show how much of the daily needs can be covered by 300 grams of the food.
10
100 g
300 g
1 tbsp - 16g 1 oz - 28.35g
Vitamin C
Vit. C
Vitamin D
Vit. D
Vitamin A
Vit. A
Vitamin E
Vit. E
Vitamin B1
Vit. B1
Vitamin B2
Vit. B2
Vitamin B3
Vit. B3
Vitamin B5
Vit. B5
Vitamin B6
Vit. B6
Vitamin B12
Vit. B12
Vitamin K
Vit. K
Folate
Folate
0%
44%
90%
38%
48%
143%
2.3%
210%
74%
2500%
1.5%
38%
1
100 g
300 g
3 oz - 85g
Vitamin C
Vit. C
Vitamin D
Vit. D
Vitamin A
Vit. A
Vitamin E
Vit. E
Vitamin B1
Vit. B1
Vitamin B2
Vit. B2
Vitamin B3
Vit. B3
Vitamin B5
Vit. B5
Vitamin B6
Vit. B6
Vitamin B12
Vit. B12
Vitamin K
Vit. K
Folate
Folate
0%
0%
0.67%
0%
3%
5.5%
20%
22%
26%
269%
0%
15%
All nutrients comparison - raw data values
Nutrient
DV% diff.
Vitamin B12
20µg
2.15µg
744%
Cholesterol
588mg
41mg
182%
Iron
11.88mg
0.58mg
141%
Selenium
65.5µg
21.7µg
80%
Choline
490.9mg
110.7mg
69%
Magnesium
300mg
37mg
63%
Vitamin B5
3.5mg
0.366mg
63%
Polyunsaturated fat
7.405g
0.222g
48%
Vitamin B2
0.62mg
0.024mg
46%
Sodium
1500mg
667mg
36%
Vitamin A
271µg
2µg
30%
Calcium
275mg
10mg
27%
Fats
17.9g
0.84g
26%
Saturated fat
4.06g
0.218g
17%
Vitamin B6
0.32mg
0.112mg
16%
Vitamin D
2.9µg
0µg
15%
Vitamin B1
0.19mg
0.012mg
15%
Vitamin D*
117 IU
2 IU
14%
Vitamin E
1.89mg
0mg
13%
Monounsaturated fat
4.631g
0.082g
11%
Phosphorus
356mg
426mg
10%
Copper
0.11mg
0.033mg
9%
Calories
264kcal
111kcal
8%
Protein
24.6g
20.54g
8%
Folate
50µg
20µg
8%
Vitamin B3
0.12mg
1.076mg
6%
Zinc
0.95mg
1.55mg
5%
Potassium
181mg
314mg
4%
Starch
3.69g
2%
Manganese
0.05mg
0.029mg
1%
Vitamin K
0.6µg
0µg
1%
Protein per 100 calories
9.3g
19g
N/A
Calories per 10 g protein
107kcal
54kcal
N/A
Weight per 100 calories
38g
90g
N/A
Unsaturated / Saturated Fat ratio
3
1.4
N/A
Net carbs
4g
5.41g
N/A
Carbs
4g
5.41g
0%
Trans fat
0.009g
N/A
Tryptophan
0.323mg
0.173mg
0%
Threonine
1.263mg
0.629mg
0%
Isoleucine
1.035mg
0.692mg
0%
Leucine
2.133mg
1.226mg
0%
Lysine
1.834mg
1.258mg
0%
Methionine
0.646mg
0.487mg
0%
Phenylalanine
1.071mg
0.597mg
0%
Valine
1.263mg
0.645mg
0%
Histidine
0.649mg
0.314mg
0%
Omega-3 - EPA
2.741g
0.072g
N/A
Omega-3 - DHA
3.8g
0.104g
N/A
Omega-3 - DPA
0.229g
0.005g
N/A
Omega-6 - Eicosadienoic acid
0.002g
N/A
Macronutrient Comparison
Macronutrient breakdown side-by-side comparison
3
25%
18%
4%
48%
6%
Protein:
24.6 g
Fats:
17.9 g
Carbs:
4 g
Water:
47.5 g
Other:
6 g
2
21%
5%
70%
3%
Protein:
20.54 g
Fats:
0.84 g
Carbs:
5.41 g
Water:
70.25 g
Other:
2.96 g
Contains
more
Protein Protein
+19.8%
Contains
more
Fats Fats
+2031%
Contains
more
Other Other
+102.7%
Contains
more
Carbs Carbs
+35.3%
Contains
more
Water Water
+47.9%
Fat Type Comparison
Fat type breakdown side-by-side comparison
2
25%
29%
46%
Saturated fat:
Sat. Fat
4.06 g
Monounsaturated fat:
Mono. Fat
4.631 g
Polyunsaturated fat:
Poly. Fat
7.405 g
1
42%
16%
43%
Saturated fat:
Sat. Fat
0.218 g
Monounsaturated fat:
Mono. Fat
0.082 g
Polyunsaturated fat:
Poly. Fat
0.222 g
Contains
more
Mono. Fat Monounsaturated fat
+5547.6%
Contains
more
Poly. Fat Polyunsaturated fat
+3235.6%
Contains
less
Sat. Fat Saturated fat
-94.6%