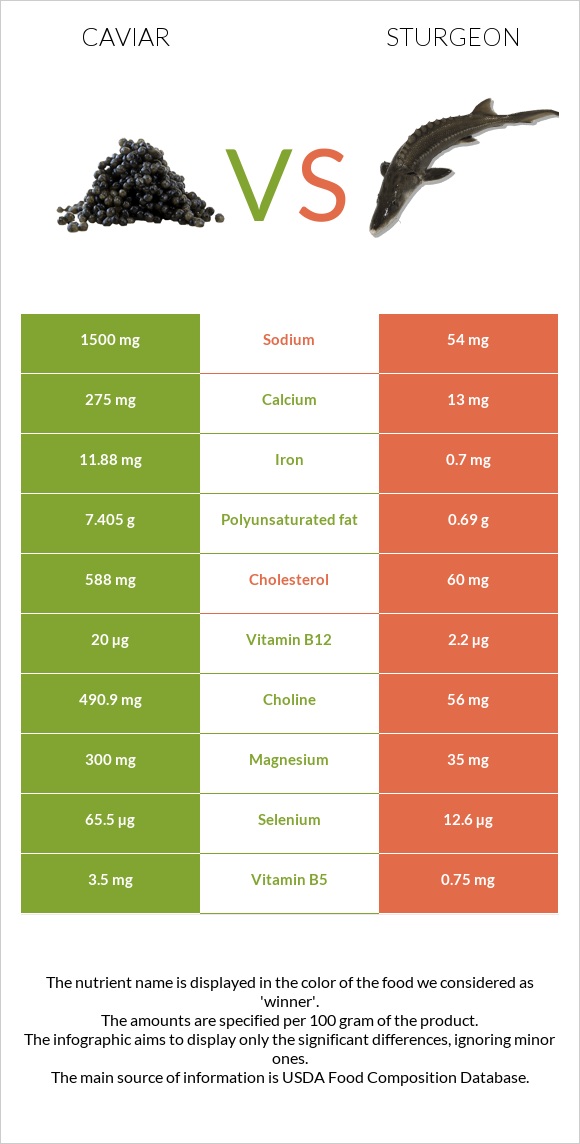
What are the differences between caviar and sturgeon? Caviar is higher in vitamin B12, iron, selenium, choline, magnesium, and vitamin B5, yet sturgeon is higher in vitamin B3 and vitamin D*. Caviar's daily need coverage for vitamin B12 is 729% more. Caviar has 22 times more sodium than sturgeon. While caviar has 1500mg of sodium, sturgeon has only 69mg. We used Fish, caviar, black, and red, granular and Fish, sturgeon, mixed species, cooked, dry heat types in this article.
Infographic
Mineral Comparison
Mineral comparison score is based on the number of minerals by which one or the other food is richer. The "coverage" charts below show how much of the daily needs can be covered by 300 grams of the food.
8
100 g
300 g
1 tbsp - 16g 1 oz - 28.35g
Magnesium
Magnesium
Calcium
Calcium
Potassium
Potassium
Iron
Iron
Copper
Copper
Zinc
Zinc
Phosphorus
Phosphorus
Sodium
Sodium
Manganese
Manganese
Selenium
Selenium
214%
83%
16%
446%
37%
26%
153%
196%
6.5%
357%
2
100 g
300 g
1 cubic inch, boneless - 17g 1 oz, boneless - 28.35g 3 oz - 85g 1 cup, cooked - 136g 1 piece (4-1/2" x 2-1/8" x 7/8") - 145g
Magnesium
Magnesium
Calcium
Calcium
Potassium
Potassium
Iron
Iron
Copper
Copper
Zinc
Zinc
Phosphorus
Phosphorus
Sodium
Sodium
Manganese
Manganese
Selenium
Selenium
32%
5.1%
32%
34%
18%
15%
116%
9%
3.9%
88%
Vitamin Comparison
Vitamin comparison score is based on the number of vitamins by which one or the other food is richer. The "coverage" charts below show how much of the daily needs can be covered by 300 grams of the food.
8
100 g
300 g
1 tbsp - 16g 1 oz - 28.35g
Vitamin C
Vit. C
Vitamin D
Vit. D
Vitamin A
Vit. A
Vitamin E
Vit. E
Vitamin B1
Vit. B1
Vitamin B2
Vit. B2
Vitamin B3
Vit. B3
Vitamin B5
Vit. B5
Vitamin B6
Vit. B6
Vitamin B12
Vit. B12
Vitamin K
Vit. K
Folate
Folate
0%
44%
90%
38%
48%
143%
2.3%
210%
74%
2500%
1.5%
38%
2
100 g
300 g
1 cubic inch, boneless - 17g 1 oz, boneless - 28.35g 3 oz - 85g 1 cup, cooked - 136g 1 piece (4-1/2" x 2-1/8" x 7/8") - 145g
Vitamin C
Vit. C
Vitamin D
Vit. D
Vitamin A
Vit. A
Vitamin E
Vit. E
Vitamin B1
Vit. B1
Vitamin B2
Vit. B2
Vitamin B3
Vit. B3
Vitamin B5
Vit. B5
Vitamin B6
Vit. B6
Vitamin B12
Vit. B12
Vitamin K
Vit. K
Folate
Folate
0%
194%
88%
13%
20%
21%
189%
52%
53%
313%
0.25%
13%
All nutrients comparison - raw data values
Nutrient
DV% diff.
Vitamin B12
20µg
2.5µg
729%
Cholesterol
588mg
77mg
170%
Iron
11.88mg
0.9mg
137%
Selenium
65.5µg
16.2µg
90%
Choline
490.9mg
70mg
77%
Sodium
1500mg
69mg
62%
Vitamin B3
0.12mg
10.1mg
62%
Magnesium
300mg
45mg
61%
Vitamin B5
3.5mg
0.87mg
53%
Vitamin D*
117 IU
515 IU
50%
Vitamin D
2.9µg
12.9µg
50%
Polyunsaturated fat
7.405g
0.885g
43%
Vitamin B2
0.62mg
0.09mg
41%
Calcium
275mg
17mg
26%
Fats
17.9g
5.18g
20%
Saturated fat
4.06g
1.173g
13%
Phosphorus
356mg
271mg
12%
Vitamin B1
0.19mg
0.08mg
9%
Protein
24.6g
20.7g
8%
Vitamin E
1.89mg
0.63mg
8%
Folate
50µg
17µg
8%
Vitamin B6
0.32mg
0.23mg
7%
Calories
264kcal
135kcal
6%
Copper
0.11mg
0.053mg
6%
Potassium
181mg
364mg
5%
Monounsaturated fat
4.631g
2.486g
5%
Zinc
0.95mg
0.54mg
4%
Carbs
4g
0g
1%
Vitamin A
271µg
263µg
1%
Manganese
0.05mg
0.03mg
1%
Protein per 100 calories
9.3g
15g
N/A
Calories per 10 g protein
107kcal
65kcal
N/A
Weight per 100 calories
38g
74g
N/A
Unsaturated / Saturated Fat ratio
3
2.9
N/A
Net carbs
4g
0g
N/A
Vitamin K
0.6µg
0.1µg
0%
Tryptophan
0.323mg
0.232mg
0%
Threonine
1.263mg
0.907mg
0%
Isoleucine
1.035mg
0.954mg
0%
Leucine
2.133mg
1.682mg
0%
Lysine
1.834mg
1.901mg
0%
Methionine
0.646mg
0.613mg
0%
Phenylalanine
1.071mg
0.808mg
0%
Valine
1.263mg
1.066mg
0%
Histidine
0.649mg
0.609mg
0%
Omega-3 - EPA
2.741g
0.249g
N/A
Omega-3 - DHA
3.8g
0.119g
N/A
Omega-3 - DPA
0.229g
0.058g
N/A
Macronutrient Comparison
Macronutrient breakdown side-by-side comparison
4
25%
18%
4%
48%
6%
Protein:
24.6 g
Fats:
17.9 g
Carbs:
4 g
Water:
47.5 g
Other:
6 g
1
21%
5%
70%
4%
Protein:
20.7 g
Fats:
5.18 g
Carbs:
0 g
Water:
69.94 g
Other:
4.18 g
Contains
more
Protein Protein
+18.8%
Contains
more
Fats Fats
+245.6%
Contains
more
Carbs Carbs
+∞%
Contains
more
Other Other
+43.5%
Contains
more
Water Water
+47.2%
Fat Type Comparison
Fat type breakdown side-by-side comparison
2
25%
29%
46%
Saturated fat:
Sat. Fat
4.06 g
Monounsaturated fat:
Mono. Fat
4.631 g
Polyunsaturated fat:
Poly. Fat
7.405 g
1
26%
55%
19%
Saturated fat:
Sat. Fat
1.173 g
Monounsaturated fat:
Mono. Fat
2.486 g
Polyunsaturated fat:
Poly. Fat
0.885 g
Contains
more
Mono. Fat Monounsaturated fat
+86.3%
Contains
more
Poly. Fat Polyunsaturated fat
+736.7%
Contains
less
Sat. Fat Saturated fat
-71.1%