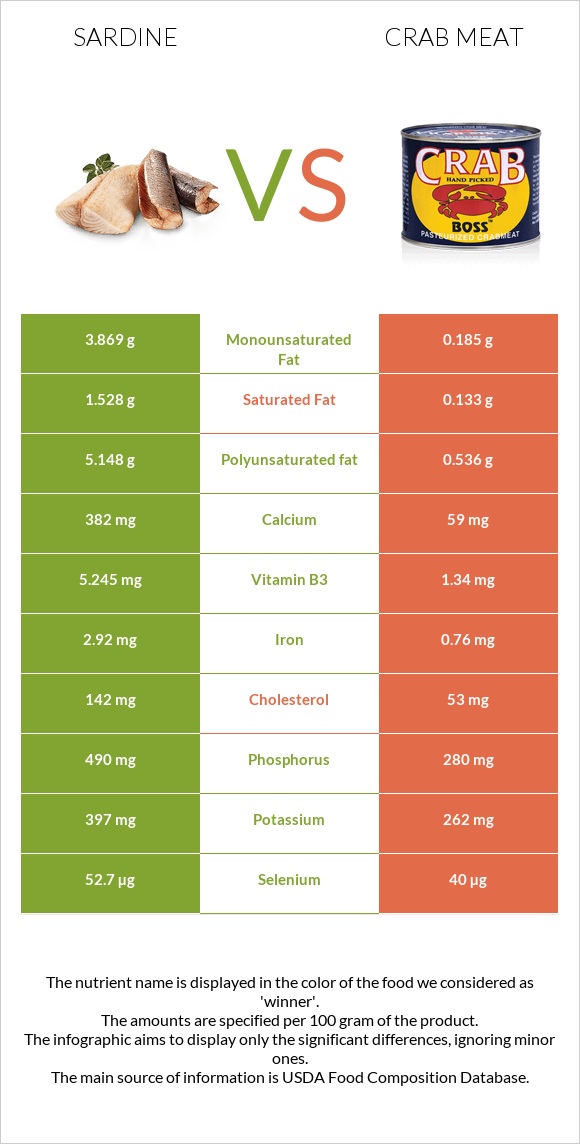
A recap on the differences between sardines and crab meat Sardines are higher in calcium, phosphorus, iron, vitamin B3, and selenium, yet crab meat is higher in copper, vitamin B12, and zinc. Crab meat covers your daily copper needs 111% more than sardines. Sardines contain 6 times more calcium than crab meat. While sardines contain 382mg of calcium, crab meat contains only 59mg. The amount of cholesterol in crab meat is lower. Food varieties used in this article are Fish, sardine, Atlantic, canned in oil, drained solids with bone and Crustaceans, crab, alaska king, cooked, moist heat .
Infographic
Mineral Comparison
Mineral comparison score is based on the number of minerals by which one or the other food is richer. The "coverage" charts below show how much of the daily needs can be covered by 300 grams of the food.
7
100 g
300 g
1 small (2-2/3" x 1/2" x 1/4") - 12g 1 cubic inch - 16g 2 sardines - 24g 1 oz - 28.35g 1 can (3.75 oz) - 92g 1 cup, drained - 149g
Magnesium
Magnesium
Calcium
Calcium
Potassium
Potassium
Iron
Iron
Copper
Copper
Zinc
Zinc
Phosphorus
Phosphorus
Sodium
Sodium
Manganese
Manganese
Selenium
Selenium
28%
115%
35%
110%
62%
36%
210%
40%
14%
287%
3
100 g
300 g
3 oz - 85g 1 leg - 134g
Magnesium
Magnesium
Calcium
Calcium
Potassium
Potassium
Iron
Iron
Copper
Copper
Zinc
Zinc
Phosphorus
Phosphorus
Sodium
Sodium
Manganese
Manganese
Selenium
Selenium
45%
18%
23%
29%
394%
208%
120%
140%
5.2%
218%
Vitamin Comparison
Vitamin comparison score is based on the number of vitamins by which one or the other food is richer. The "coverage" charts below show how much of the daily needs can be covered by 300 grams of the food.
8
100 g
300 g
1 small (2-2/3" x 1/2" x 1/4") - 12g 1 cubic inch - 16g 2 sardines - 24g 1 oz - 28.35g 1 can (3.75 oz) - 92g 1 cup, drained - 149g
Vitamin C
Vit. C
Vitamin D
Vit. D
Vitamin A
Vit. A
Vitamin E
Vit. E
Vitamin B1
Vit. B1
Vitamin B2
Vit. B2
Vitamin B3
Vit. B3
Vitamin B5
Vit. B5
Vitamin B6
Vit. B6
Vitamin B12
Vit. B12
Vitamin K
Vit. K
Folate
Folate
0%
72%
11%
41%
20%
52%
98%
39%
39%
1118%
6.5%
7.5%
3
100 g
300 g
3 oz - 85g 1 leg - 134g
Vitamin C
Vit. C
Vitamin D
Vit. D
Vitamin A
Vit. A
Vitamin E
Vit. E
Vitamin B1
Vit. B1
Vitamin B2
Vit. B2
Vitamin B3
Vit. B3
Vitamin B5
Vit. B5
Vitamin B6
Vit. B6
Vitamin B12
Vit. B12
Vitamin K
Vit. K
Folate
Folate
25%
0%
3%
0%
13%
13%
25%
24%
42%
1438%
0%
38%
All nutrients comparison - raw data values
Nutrient
DV% diff.
Copper
0.186mg
1.182mg
111%
Vitamin B12
8.94µg
11.5µg
107%
Zinc
1.31mg
7.62mg
57%
Sodium
307mg
1072mg
33%
Calcium
382mg
59mg
32%
Polyunsaturated fat
5.148g
0.536g
31%
Cholesterol
142mg
53mg
30%
Phosphorus
490mg
280mg
30%
Iron
2.92mg
0.76mg
27%
Vitamin D*
193 IU
24%
Vitamin D
4.8µg
24%
Vitamin B3
5.245mg
1.34mg
24%
Selenium
52.7µg
40µg
23%
Fats
11.45g
1.54g
15%
Vitamin E
2.04mg
14%
Choline
75mg
14%
Vitamin B2
0.227mg
0.055mg
13%
Protein
24.62g
19.35g
11%
Folate
10µg
51µg
10%
Monounsaturated fat
3.869g
0.185g
9%
Vitamin C
0mg
7.6mg
8%
Calories
208kcal
97kcal
6%
Magnesium
39mg
63mg
6%
Saturated fat
1.528g
0.133g
6%
Vitamin B5
0.642mg
0.4mg
5%
Potassium
397mg
262mg
4%
Vitamin A
32µg
9µg
3%
Manganese
0.108mg
0.04mg
3%
Vitamin B1
0.08mg
0.053mg
2%
Vitamin K
2.6µg
2%
Vitamin B6
0.167mg
0.18mg
1%
Protein per 100 calories
12g
20g
N/A
Calories per 10 g protein
84kcal
50kcal
N/A
Weight per 100 calories
48g
103g
N/A
Unsaturated / Saturated Fat ratio
5.9
5.4
N/A
Tryptophan
0.276mg
0.269mg
0%
Threonine
1.079mg
0.783mg
0%
Isoleucine
1.134mg
0.938mg
0%
Leucine
2.001mg
1.536mg
0%
Lysine
2.26mg
1.684mg
0%
Methionine
0.729mg
0.545mg
0%
Phenylalanine
0.961mg
0.817mg
0%
Valine
1.268mg
0.91mg
0%
Histidine
0.725mg
0.393mg
0%
Omega-3 - EPA
0.473g
0.295g
N/A
Omega-3 - DHA
0.509g
0.118g
N/A
Omega-3 - DPA
0g
0.031g
N/A
Macronutrient Comparison
Macronutrient breakdown side-by-side comparison
3
25%
11%
60%
4%
Protein:
24.62 g
Fats:
11.45 g
Carbs:
0 g
Water:
59.61 g
Other:
4.32 g
1
19%
78%
Protein:
19.35 g
Fats:
1.54 g
Carbs:
0 g
Water:
77.55 g
Other:
1.56 g
Contains
more
Protein Protein
+27.2%
Contains
more
Fats Fats
+643.5%
Contains
more
Other Other
+176.9%
Contains
more
Water Water
+30.1%
Fat Type Comparison
Fat type breakdown side-by-side comparison
2
14%
37%
49%
Saturated fat:
Sat. Fat
1.528 g
Monounsaturated fat:
Mono. Fat
3.869 g
Polyunsaturated fat:
Poly. Fat
5.148 g
1
16%
22%
63%
Saturated fat:
Sat. Fat
0.133 g
Monounsaturated fat:
Mono. Fat
0.185 g
Polyunsaturated fat:
Poly. Fat
0.536 g
Contains
more
Mono. Fat Monounsaturated fat
+1991.4%
Contains
more
Poly. Fat Polyunsaturated fat
+860.4%
Contains
less
Sat. Fat Saturated fat
-91.3%