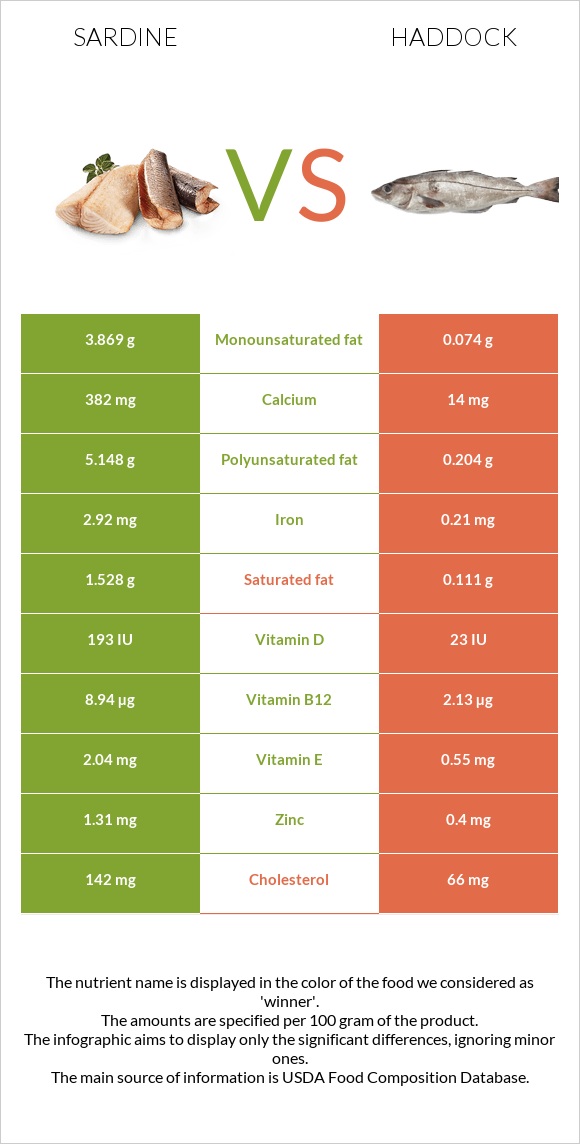
Important differences between sardines and haddock Sardines have more vitamin B12, selenium, calcium, iron, phosphorus, vitamin D*, copper, and vitamin B2; however, haddock has more vitamin B6. Sardines' daily need coverage for vitamin B12 is 284% more. Sardines have 27 times more calcium than haddock. Sardines have 382mg of calcium, while haddock has 14mg. Haddock is lower in cholesterol. The food varieties used in the comparison are Fish, sardine, Atlantic, canned in oil, drained solids with bone and Fish, haddock, cooked, dry heat .
Infographic
Mineral Comparison
Mineral comparison score is based on the number of minerals by which one or the other food is richer. The "coverage" charts below show how much of the daily needs can be covered by 300 grams of the food.
9
100 g
300 g
1 small (2-2/3" x 1/2" x 1/4") - 12g 1 cubic inch - 16g 2 sardines - 24g 1 oz - 28.35g 1 can (3.75 oz) - 92g 1 cup, drained - 149g
Magnesium
Magnesium
Calcium
Calcium
Potassium
Potassium
Iron
Iron
Copper
Copper
Zinc
Zinc
Phosphorus
Phosphorus
Sodium
Sodium
Manganese
Manganese
Selenium
Selenium
28%
115%
35%
110%
62%
36%
210%
40%
14%
287%
1
100 g
300 g
3 oz - 85g 1 fillet - 150g
Magnesium
Magnesium
Calcium
Calcium
Potassium
Potassium
Iron
Iron
Copper
Copper
Zinc
Zinc
Phosphorus
Phosphorus
Sodium
Sodium
Manganese
Manganese
Selenium
Selenium
19%
4.2%
31%
7.9%
8.7%
11%
119%
34%
1.7%
173%
Vitamin Comparison
Vitamin comparison score is based on the number of vitamins by which one or the other food is richer. The "coverage" charts below show how much of the daily needs can be covered by 300 grams of the food.
9
100 g
300 g
1 small (2-2/3" x 1/2" x 1/4") - 12g 1 cubic inch - 16g 2 sardines - 24g 1 oz - 28.35g 1 can (3.75 oz) - 92g 1 cup, drained - 149g
Vitamin C
Vit. C
Vitamin D
Vit. D
Vitamin A
Vit. A
Vitamin E
Vit. E
Vitamin B1
Vit. B1
Vitamin B2
Vit. B2
Vitamin B3
Vit. B3
Vitamin B5
Vit. B5
Vitamin B6
Vit. B6
Vitamin B12
Vit. B12
Vitamin K
Vit. K
Folate
Folate
0%
72%
11%
41%
20%
52%
98%
39%
39%
1118%
6.5%
7.5%
2
100 g
300 g
3 oz - 85g 1 fillet - 150g
Vitamin C
Vit. C
Vitamin D
Vit. D
Vitamin A
Vit. A
Vitamin E
Vit. E
Vitamin B1
Vit. B1
Vitamin B2
Vit. B2
Vitamin B3
Vit. B3
Vitamin B5
Vit. B5
Vitamin B6
Vit. B6
Vitamin B12
Vit. B12
Vitamin K
Vit. K
Folate
Folate
0%
9%
7%
11%
5.8%
16%
77%
30%
75%
266%
0.25%
9.8%
All nutrients comparison - raw data values
Nutrient
DV% diff.
Vitamin B12
8.94µg
2.13µg
284%
Selenium
52.7µg
31.7µg
38%
Calcium
382mg
14mg
37%
Iron
2.92mg
0.21mg
34%
Polyunsaturated fat
5.148g
0.204g
33%
Phosphorus
490mg
278mg
30%
Cholesterol
142mg
66mg
25%
Vitamin D*
193 IU
23 IU
21%
Vitamin D
4.8µg
0.6µg
21%
Copper
0.186mg
0.026mg
18%
Fats
11.45g
0.55g
17%
Vitamin B2
0.227mg
0.069mg
12%
Vitamin B6
0.167mg
0.327mg
12%
Vitamin E
2.04mg
0.55mg
10%
Protein
24.62g
19.99g
9%
Monounsaturated fat
3.869g
0.074g
9%
Zinc
1.31mg
0.4mg
8%
Vitamin B3
5.245mg
4.119mg
7%
Calories
208kcal
90kcal
6%
Saturated fat
1.528g
0.111g
6%
Vitamin B1
0.08mg
0.023mg
5%
Manganese
0.108mg
0.013mg
4%
Magnesium
39mg
26mg
3%
Vitamin B5
0.642mg
0.494mg
3%
Sodium
307mg
261mg
2%
Vitamin K
2.6µg
0.1µg
2%
Potassium
397mg
351mg
1%
Vitamin A
32µg
21µg
1%
Folate
10µg
13µg
1%
Choline
75mg
79.6mg
1%
Protein per 100 calories
12g
22g
N/A
Calories per 10 g protein
84kcal
45kcal
N/A
Weight per 100 calories
48g
111g
N/A
Unsaturated / Saturated Fat ratio
5.9
2.5
N/A
Trans fat
0.005g
N/A
Tryptophan
0.276mg
0.26mg
0%
Threonine
1.079mg
1.015mg
0%
Isoleucine
1.134mg
1.067mg
0%
Leucine
2.001mg
1.882mg
0%
Lysine
2.26mg
2.126mg
0%
Methionine
0.729mg
0.686mg
0%
Phenylalanine
0.961mg
0.904mg
0%
Valine
1.268mg
1.193mg
0%
Histidine
0.725mg
0.682mg
0%
Omega-3 - EPA
0.473g
0.051g
N/A
Omega-3 - DHA
0.509g
0.109g
N/A
Omega-3 - DPA
0g
0.006g
N/A
Omega-6 - Eicosadienoic acid
0.001g
N/A
Macronutrient Comparison
Macronutrient breakdown side-by-side comparison
3
25%
11%
60%
4%
Protein:
24.62 g
Fats:
11.45 g
Carbs:
0 g
Water:
59.61 g
Other:
4.32 g
1
20%
79%
Protein:
19.99 g
Fats:
0.55 g
Carbs:
0 g
Water:
79.65 g
Other:
0 g
Contains
more
Protein Protein
+23.2%
Contains
more
Fats Fats
+1981.8%
Contains
more
Other Other
+∞%
Contains
more
Water Water
+33.6%
Fat Type Comparison
Fat type breakdown side-by-side comparison
2
14%
37%
49%
Saturated fat:
Sat. Fat
1.528 g
Monounsaturated fat:
Mono. Fat
3.869 g
Polyunsaturated fat:
Poly. Fat
5.148 g
1
29%
19%
52%
Saturated fat:
Sat. Fat
0.111 g
Monounsaturated fat:
Mono. Fat
0.074 g
Polyunsaturated fat:
Poly. Fat
0.204 g
Contains
more
Mono. Fat Monounsaturated fat
+5128.4%
Contains
more
Poly. Fat Polyunsaturated fat
+2423.5%
Contains
less
Sat. Fat Saturated fat
-92.7%