How are fish soup and succotash different? Fish soup is higher in vitamin B12; however, succotash is richer in manganese, iron, vitamin C, fiber, vitamin B1, copper, magnesium, folate, and phosphorus. Daily need coverage for vitamin B12 for fish soup is 29% higher. Soup, stock, fish, home-prepared and Succotash, (corn and limas), raw are the varieties used in this article.
Infographic
Mineral Comparison
Mineral comparison score is based on the number of minerals by which one or the other food is richer. The "coverage" charts below show how much of the daily needs can be covered by 300 grams of the food.
1
100 g
300 g
1 cup - 233g
Magnesium
Magnesium
Calcium
Calcium
Potassium
Potassium
Iron
Iron
Copper
Copper
Zinc
Zinc
Phosphorus
Phosphorus
Sodium
Sodium
Manganese
Manganese
Selenium
Selenium
5%
0.9%
13%
0.38%
19%
1.6%
24%
20%
6.8%
5.5%
9
100 g
300 g
Magnesium
Magnesium
Calcium
Calcium
Potassium
Potassium
Iron
Iron
Copper
Copper
Zinc
Zinc
Phosphorus
Phosphorus
Sodium
Sodium
Manganese
Manganese
Selenium
Selenium
34%
5.4%
33%
69%
62%
17%
48%
0.52%
90%
3.3%
Vitamin Comparison
Vitamin comparison score is based on the number of vitamins by which one or the other food is richer. The "coverage" charts below show how much of the daily needs can be covered by 300 grams of the food.
3
100 g
300 g
1 cup - 233g
Vitamin C
Vit. C
Vitamin D
Vit. D
Vitamin A
Vit. A
Vitamin E
Vit. E
Vitamin B1
Vit. B1
Vitamin B2
Vit. B2
Vitamin B3
Vit. B3
Vitamin B5
Vit. B5
Vitamin B6
Vit. B6
Vitamin B12
Vit. B12
Vitamin K
Vit. K
Folate
Folate
0.33%
0%
0.67%
3.4%
8.3%
18%
22%
20%
8.5%
86%
0%
1.5%
6
100 g
300 g
Vitamin C
Vit. C
Vitamin D
Vit. D
Vitamin A
Vit. A
Vitamin E
Vit. E
Vitamin B1
Vit. B1
Vitamin B2
Vit. B2
Vitamin B3
Vit. B3
Vitamin B5
Vit. B5
Vitamin B6
Vit. B6
Vitamin B12
Vit. B12
Vitamin K
Vit. K
Folate
Folate
50%
0%
5%
0%
52%
19%
30%
7.7%
30%
0%
0%
30%
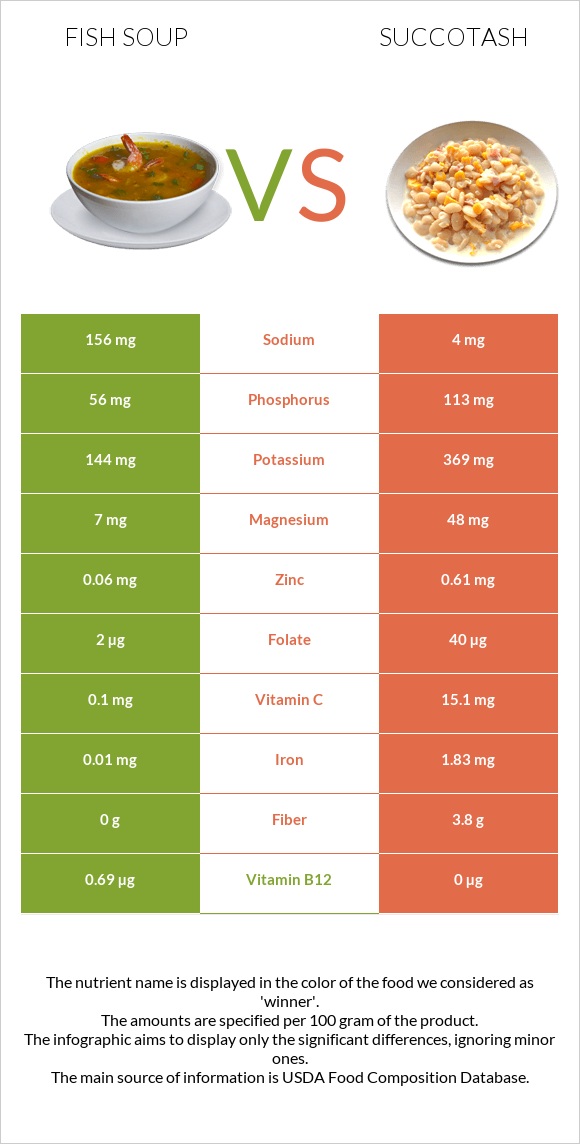
All nutrients comparison - raw data values
Nutrient
DV% diff.
Vitamin B12
0.69µg
0µg
29%
Manganese
0.052mg
0.688mg
28%
Iron
0.01mg
1.83mg
23%
Vitamin C
0.1mg
15.1mg
17%
Fiber
0g
3.8g
15%
Vitamin B1
0.033mg
0.208mg
15%
Copper
0.058mg
0.186mg
14%
Magnesium
7mg
48mg
10%
Folate
2µg
40µg
10%
Phosphorus
56mg
113mg
8%
Carbs
0g
19.59g
7%
Potassium
144mg
369mg
7%
Sodium
156mg
4mg
7%
Vitamin B6
0.037mg
0.13mg
7%
Protein
2.26g
5.03g
6%
Zinc
0.06mg
0.61mg
5%
Calories
16kcal
99kcal
4%
Vitamin B5
0.329mg
0.128mg
4%
Vitamin B3
1.186mg
1.587mg
3%
Calcium
3mg
18mg
2%
Polyunsaturated fat
0.138g
0.489g
2%
Vitamin A
2µg
15µg
1%
Vitamin E
0.17mg
1%
Selenium
1µg
0.6µg
1%
Choline
7mg
1%
Protein per 100 calories
14g
5.1g
N/A
Calories per 10 g protein
71kcal
197kcal
N/A
Weight per 100 calories
625g
101g
N/A
Fats
0.81g
1.02g
0%
Net carbs
0g
15.79g
N/A
Cholesterol
1mg
0mg
0%
Vitamin B2
0.076mg
0.082mg
0%
Saturated fat
0.203g
0.19g
0%
Monounsaturated fat
0.236g
0.198g
0%
Tryptophan
0.056mg
0%
Threonine
0.209mg
0%
Isoleucine
0.284mg
0%
Leucine
0.443mg
0%
Lysine
0.295mg
0%
Methionine
0.068mg
0%
Phenylalanine
0.243mg
0%
Valine
0.306mg
0%
Histidine
0.16mg
0%
Omega-3 - EPA
0.035g
N/A
Omega-3 - DHA
0.049g
N/A
Omega-3 - DPA
0.017g
N/A
Macronutrient Comparison
Macronutrient breakdown side-by-side comparison
1
2%
97%
Protein:
2.26 g
Fats:
0.81 g
Carbs:
0 g
Water:
96.6 g
Other:
0.33 g
4
5%
20%
73%
Protein:
5.03 g
Fats:
1.02 g
Carbs:
19.59 g
Water:
73.1 g
Other:
1.26 g
Contains
more
Water Water
+32.1%
Contains
more
Protein Protein
+122.6%
Contains
more
Fats Fats
+25.9%
Contains
more
Carbs Carbs
+∞%
Contains
more
Other Other
+281.8%
Fat Type Comparison
Fat type breakdown side-by-side comparison
1
35%
41%
24%
Saturated fat:
Sat. Fat
0.203 g
Monounsaturated fat:
Mono. Fat
0.236 g
Polyunsaturated fat:
Poly. Fat
0.138 g
2
22%
23%
56%
Saturated fat:
Sat. Fat
0.19 g
Monounsaturated fat:
Mono. Fat
0.198 g
Polyunsaturated fat:
Poly. Fat
0.489 g
Contains
more
Mono. Fat Monounsaturated fat
+19.2%
Contains
more
Poly. Fat Polyunsaturated fat
+254.3%
~equal in
Saturated fat
~0.19g