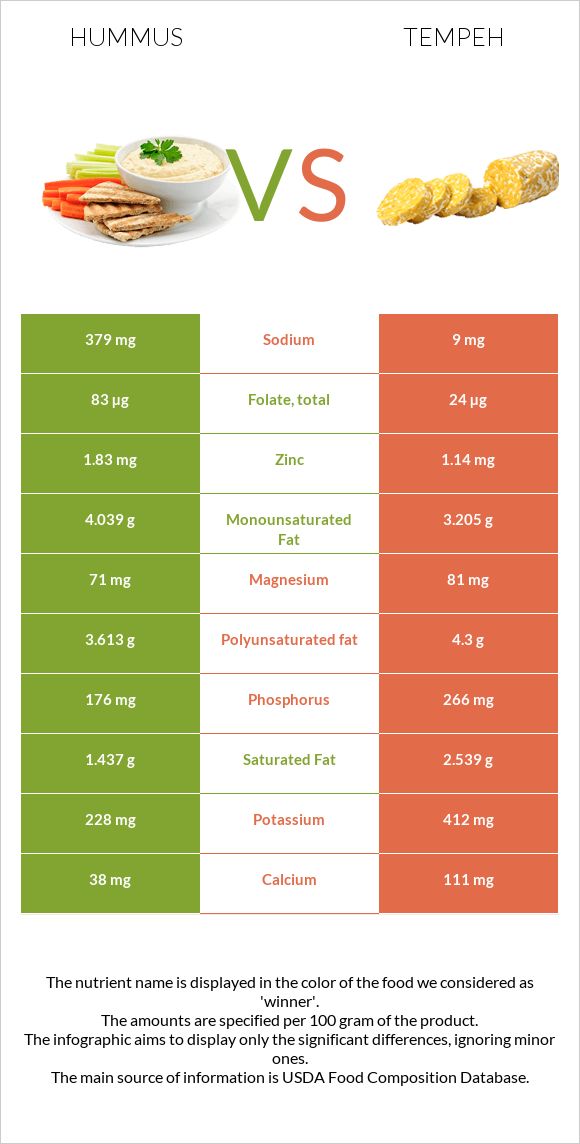
Important differences between hummus and tempeh Hummus has more folate, vitamin B1, and zinc; however, tempeh has more manganese, vitamin B2, vitamin B3, phosphorus, and calcium. Tempeh's daily need coverage for manganese is 23% more. Hummus has 42 times more sodium than tempeh. Hummus has 379mg of sodium, while tempeh has 9mg. The food varieties used in the comparison are Hummus, commercial and Tempeh .
Infographic
Mineral Comparison
Mineral comparison score is based on the number of minerals by which one or the other food is richer. The "coverage" charts below show how much of the daily needs can be covered by 300 grams of the food.
2
100 g
300 g
1 tbsp - 15g 1 cup - 246g
Magnesium
Magnesium
Calcium
Calcium
Potassium
Potassium
Iron
Iron
Copper
Copper
Zinc
Zinc
Phosphorus
Phosphorus
Sodium
Sodium
Manganese
Manganese
Selenium
Selenium
51%
11%
20%
92%
176%
50%
75%
49%
101%
14%
7
100 g
300 g
1 cup - 166g
Magnesium
Magnesium
Calcium
Calcium
Potassium
Potassium
Iron
Iron
Copper
Copper
Zinc
Zinc
Phosphorus
Phosphorus
Sodium
Sodium
Manganese
Manganese
Selenium
Selenium
58%
33%
36%
101%
187%
31%
114%
1.2%
170%
0%
Vitamin Comparison
Vitamin comparison score is based on the number of vitamins by which one or the other food is richer. The "coverage" charts below show how much of the daily needs can be covered by 300 grams of the food.
2
100 g
300 g
1 tbsp - 15g 1 cup - 246g
Vitamin C
Vit. C
Vitamin D
Vit. D
Vitamin A
Vit. A
Vitamin E
Vit. E
Vitamin B1
Vit. B1
Vitamin B2
Vit. B2
Vitamin B3
Vit. B3
Vitamin B5
Vit. B5
Vitamin B6
Vit. B6
Vitamin B12
Vit. B12
Vitamin K
Vit. K
Folate
Folate
0%
0%
0%
0%
45%
15%
11%
7.9%
46%
0%
0%
62%
4
100 g
300 g
1 cup - 166g
Vitamin C
Vit. C
Vitamin D
Vit. D
Vitamin A
Vit. A
Vitamin E
Vit. E
Vitamin B1
Vit. B1
Vitamin B2
Vit. B2
Vitamin B3
Vit. B3
Vitamin B5
Vit. B5
Vitamin B6
Vit. B6
Vitamin B12
Vit. B12
Vitamin K
Vit. K
Folate
Folate
0%
0%
0%
0%
20%
83%
50%
17%
50%
10%
0%
18%
All nutrients comparison - raw data values
Nutrient
DV% diff.
Protein
7.9g
20.29g
25%
Fiber
6g
24%
Manganese
0.773mg
1.3mg
23%
Vitamin B2
0.064mg
0.358mg
23%
Sodium
379mg
9mg
16%
Folate
83µg
24µg
15%
Phosphorus
176mg
266mg
13%
Vitamin B3
0.582mg
2.64mg
13%
Vitamin B1
0.18mg
0.078mg
9%
Calcium
38mg
111mg
7%
Zinc
1.83mg
1.14mg
6%
Potassium
228mg
412mg
5%
Selenium
2.6µg
0µg
5%
Saturated fat
1.437g
2.539g
5%
Polyunsaturated fat
3.613g
4.3g
5%
Copper
0.527mg
0.56mg
4%
Iron
2.44mg
2.7mg
3%
Vitamin B5
0.132mg
0.278mg
3%
Vitamin B12
0µg
0.08µg
3%
Fats
9.6g
10.8g
2%
Carbs
14.29g
7.64g
2%
Magnesium
71mg
81mg
2%
Monounsaturated fat
4.039g
3.205g
2%
Calories
166kcal
192kcal
1%
Vitamin B6
0.2mg
0.215mg
1%
Protein per 100 calories
4.8g
11g
N/A
Calories per 10 g protein
210kcal
95kcal
N/A
Weight per 100 calories
60g
52g
N/A
Unsaturated / Saturated Fat ratio
5.3
3
N/A
Net carbs
8.29g
7.64g
N/A
Tryptophan
0.194mg
0%
Threonine
0.796mg
0%
Isoleucine
0.88mg
0%
Leucine
1.43mg
0%
Lysine
0.908mg
0%
Methionine
0.175mg
0%
Phenylalanine
0.893mg
0%
Valine
0.92mg
0%
Histidine
0.466mg
0%
Macronutrient Comparison
Macronutrient breakdown side-by-side comparison
2
8%
10%
14%
67%
Protein:
7.9 g
Fats:
9.6 g
Carbs:
14.29 g
Water:
66.59 g
Other:
1.62 g
2
20%
11%
8%
60%
Protein:
20.29 g
Fats:
10.8 g
Carbs:
7.64 g
Water:
59.65 g
Other:
1.62 g
Contains
more
Carbs Carbs
+87%
Contains
more
Water Water
+11.6%
Contains
more
Protein Protein
+156.8%
Contains
more
Fats Fats
+12.5%
Fat Type Comparison
Fat type breakdown side-by-side comparison
2
16%
44%
40%
Saturated fat:
Sat. Fat
1.437 g
Monounsaturated fat:
Mono. Fat
4.039 g
Polyunsaturated fat:
Poly. Fat
3.613 g
1
25%
32%
43%
Saturated fat:
Sat. Fat
2.539 g
Monounsaturated fat:
Mono. Fat
3.205 g
Polyunsaturated fat:
Poly. Fat
4.3 g
Contains
less
Sat. Fat Saturated fat
-43.4%
Contains
more
Mono. Fat Monounsaturated fat
+26%
Contains
more
Poly. Fat Polyunsaturated fat
+19%