Java plum vs. Navajo frybread — In-Depth Nutrition Comparison
Compare
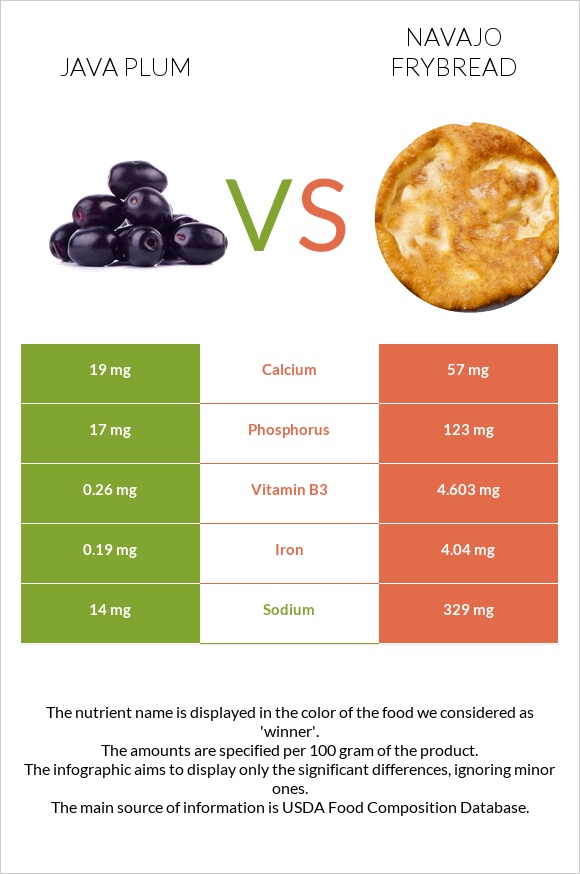
What are the differences between java plum and navajo frybread?
- Navajo frybread is richer than java plum in iron, vitamin B1, vitamin B3, vitamin B2, and phosphorus.
- Navajo frybread's daily need coverage for iron is 48% more.
- The amount of sodium in java plum is lower.
We used Java-plum, (jambolan), raw and Frybread, made with lard (Navajo) types in this article.
Infographic
Infographic link
Mineral Comparison
Mineral comparison score is based on the number of minerals by which one or the other food is richer. The "coverage" charts below show how much of the daily needs can be covered by 300 grams of the food.
| Contains less SodiumSodium | -95.7% |
| Contains more MagnesiumMagnesium | +20% |
| Contains more CalciumCalcium | +200% |
| Contains more IronIron | +2026.3% |
| Contains more PhosphorusPhosphorus | +623.5% |
Vitamin Comparison
Vitamin comparison score is based on the number of vitamins by which one or the other food is richer. The "coverage" charts below show how much of the daily needs can be covered by 300 grams of the food.
| Contains more Vitamin CVitamin C | +∞% |
| Contains more Vitamin B1Vitamin B1 | +7066.7% |
| Contains more Vitamin B2Vitamin B2 | +1708.3% |
| Contains more Vitamin B3Vitamin B3 | +1670.4% |
All nutrients comparison - raw data values
| Nutrient |  |
 |
DV% diff. |
| Iron | 0.19mg | 4.04mg | 48% |
| Vitamin B1 | 0.006mg | 0.43mg | 35% |
| Selenium | 18.6µg | 34% | |
| Folate | 122µg | 31% | |
| Vitamin B3 | 0.26mg | 4.603mg | 27% |
| Saturated fat | 4.621g | 21% | |
| Starch | 42.85g | 18% | |
| Fats | 0.23g | 12.22g | 18% |
| Vitamin C | 14.3mg | 16% | |
| Vitamin B2 | 0.012mg | 0.217mg | 16% |
| Phosphorus | 17mg | 123mg | 15% |
| Calories | 60kcal | 330kcal | 14% |
| Sodium | 14mg | 329mg | 14% |
| Manganese | 0.297mg | 13% | |
| Protein | 0.72g | 6.69g | 12% |
| Monounsaturated fat | 4.411g | 11% | |
| Carbs | 15.56g | 48.26g | 11% |
| Copper | 0.091mg | 10% | |
| Polyunsaturated fat | 1.055g | 7% | |
| Calcium | 19mg | 57mg | 4% |
| Zinc | 0.35mg | 3% | |
| Vitamin B5 | 0.164mg | 3% | |
| Cholesterol | 0mg | 7mg | 2% |
| Vitamin K | 0.8µg | 1% | |
| Magnesium | 15mg | 18mg | 1% |
| Net carbs | 15.56g | 48.26g | N/A |
| Potassium | 79mg | 77mg | 0% |
| Sugar | 2.03g | N/A | |
| Vitamin B6 | 0.038mg | 0.038mg | 0% |
| Omega-3 - ALA | 0.051g | N/A | |
| Omega-6 - Gamma-linoleic acid | 0.004g | N/A | |
| Omega-6 - Eicosadienoic acid | 0.018g | N/A |
Macronutrient Comparison
Macronutrient breakdown side-by-side comparison
Protein:
0.72 g
Fats:
0.23 g
Carbs:
15.56 g
Water:
83.13 g
Other:
0.36 g
Protein:
6.69 g
Fats:
12.22 g
Carbs:
48.26 g
Water:
31.57 g
Other:
1.26 g
| Contains more WaterWater | +163.3% |
| Contains more ProteinProtein | +829.2% |
| Contains more FatsFats | +5213% |
| Contains more CarbsCarbs | +210.2% |
| Contains more OtherOther | +250% |


