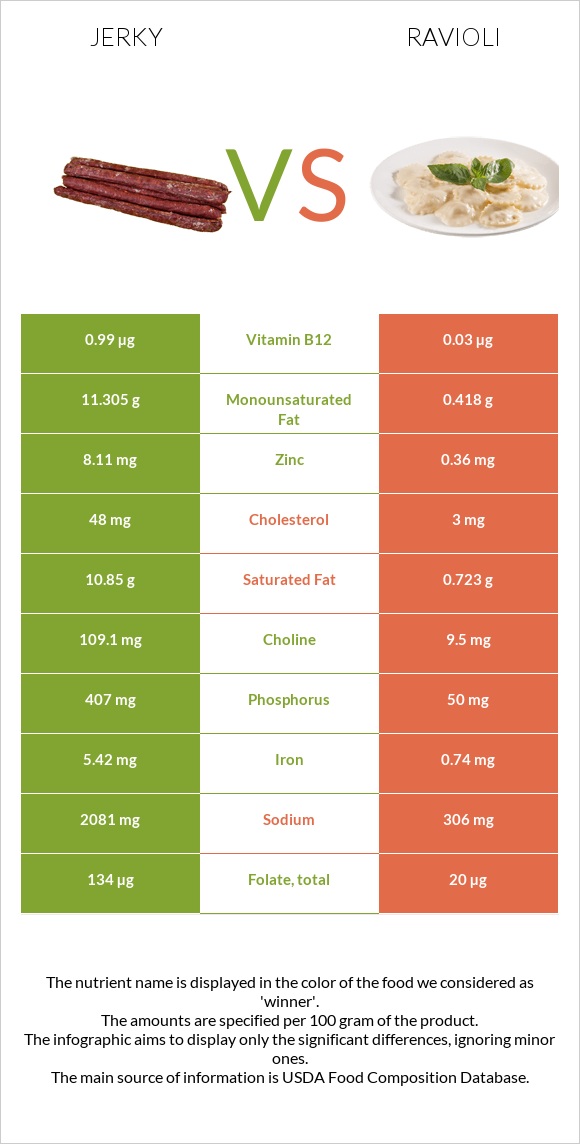
Differences between jerky and ravioli Ravioli contains less zinc, iron, phosphorus, vitamin B12, folate, choline, and selenium than jerky. Jerky's daily need coverage for sodium is 77% higher. Ravioli contains 33 times less vitamin B12 than jerky. Jerky contains 0.99µg of vitamin B12, while ravioli contains 0.03µg. The amount of cholesterol in ravioli is lower. Jerky has a lower glycemic index. The glycemic index of jerky is 0, while the glycemic index of ravioli is 39. The food types used in this comparison are Snacks, beef jerky, chopped, and formed and Ravioli, cheese-filled, canned .
Infographic
Mineral Comparison
Mineral comparison score is based on the number of minerals by which one or the other food is richer. The "coverage" charts below show how much of the daily needs can be covered by 300 grams of the food.
7
100 g
300 g
1 piece, large - 20g 1 oz - 28.35g 1 oz - 28.35g
Magnesium
Magnesium
Calcium
Calcium
Potassium
Potassium
Iron
Iron
Copper
Copper
Zinc
Zinc
Phosphorus
Phosphorus
Sodium
Sodium
Manganese
Manganese
Selenium
Selenium
36%
6%
53%
203%
76%
221%
174%
271%
14%
58%
3
100 g
300 g
1 cup - 242g
Magnesium
Magnesium
Calcium
Calcium
Potassium
Potassium
Iron
Iron
Copper
Copper
Zinc
Zinc
Phosphorus
Phosphorus
Sodium
Sodium
Manganese
Manganese
Selenium
Selenium
11%
9.9%
20%
28%
47%
9.8%
21%
40%
23%
19%
Vitamin Comparison
Vitamin comparison score is based on the number of vitamins by which one or the other food is richer. The "coverage" charts below show how much of the daily needs can be covered by 300 grams of the food.
7
100 g
300 g
1 piece, large - 20g 1 oz - 28.35g 1 oz - 28.35g
Vitamin C
Vit. C
Vitamin D
Vit. D
Vitamin A
Vit. A
Vitamin E
Vit. E
Vitamin B1
Vit. B1
Vitamin B2
Vit. B2
Vitamin B3
Vit. B3
Vitamin B5
Vit. B5
Vitamin B6
Vit. B6
Vitamin B12
Vit. B12
Vitamin K
Vit. K
Folate
Folate
0%
4.5%
0%
9.8%
39%
33%
32%
9.8%
41%
124%
5.8%
101%
3
100 g
300 g
1 cup - 242g
Vitamin C
Vit. C
Vitamin D
Vit. D
Vitamin A
Vit. A
Vitamin E
Vit. E
Vitamin B1
Vit. B1
Vitamin B2
Vit. B2
Vitamin B3
Vit. B3
Vitamin B5
Vit. B5
Vitamin B6
Vit. B6
Vitamin B12
Vit. B12
Vitamin K
Vit. K
Folate
Folate
0%
0%
3.3%
17%
19%
18%
20%
16%
24%
3.8%
5.8%
15%
All nutrients comparison - raw data values
Nutrient
DV% diff.
Sodium
2081mg
306mg
77%
Zinc
8.11mg
0.36mg
70%
Protein
33.2g
2.48g
61%
Iron
5.42mg
0.74mg
59%
Phosphorus
407mg
50mg
51%
Saturated fat
10.85g
0.723g
46%
Vitamin B12
0.99µg
0.03µg
40%
Fats
25.6g
1.45g
37%
Folate
134µg
20µg
29%
Monounsaturated fat
11.305g
0.418g
27%
Choline
109.1mg
9.5mg
18%
Calories
410kcal
77kcal
17%
Cholesterol
48mg
3mg
15%
Selenium
10.7µg
3.5µg
13%
Potassium
597mg
232mg
11%
Magnesium
51mg
15mg
9%
Copper
0.227mg
0.142mg
9%
Vitamin B1
0.154mg
0.074mg
7%
Vitamin B6
0.179mg
0.102mg
6%
Polyunsaturated fat
1.011g
0.182g
6%
Vitamin B2
0.142mg
0.08mg
5%
Vitamin B3
1.732mg
1.06mg
4%
Manganese
0.111mg
0.176mg
3%
Vitamin D
0.3µg
0µg
2%
Fiber
1.8g
1.3g
2%
Vitamin E
0.49mg
0.85mg
2%
Vitamin B5
0.163mg
0.272mg
2%
Carbs
11g
13.64g
1%
Vitamin D*
11 IU
0 IU
1%
Calcium
20mg
33mg
1%
Vitamin A
0µg
10µg
1%
Protein per 100 calories
8.1g
3.2g
N/A
Calories per 10 g protein
123kcal
310kcal
N/A
Weight per 100 calories
24g
130g
N/A
Unsaturated / Saturated Fat ratio
1.1
0.83
N/A
Net carbs
9.2g
12.34g
N/A
Sugar
9g
3.72g
N/A
Vitamin K
2.3µg
2.3µg
0%
Macronutrient Comparison
Macronutrient breakdown side-by-side comparison
3
33%
26%
11%
23%
7%
Protein:
33.2 g
Fats:
25.6 g
Carbs:
11 g
Water:
23.36 g
Other:
6.84 g
2
2%
14%
81%
Protein:
2.48 g
Fats:
1.45 g
Carbs:
13.64 g
Water:
80.91 g
Other:
1.52 g
Contains
more
Protein Protein
+1238.7%
Contains
more
Fats Fats
+1665.5%
Contains
more
Other Other
+350%
Contains
more
Carbs Carbs
+24%
Contains
more
Water Water
+246.4%
Fat Type Comparison
Fat type breakdown side-by-side comparison
2
47%
49%
4%
Saturated fat:
Sat. Fat
10.85 g
Monounsaturated fat:
Mono. Fat
11.305 g
Polyunsaturated fat:
Poly. Fat
1.011 g
1
55%
32%
14%
Saturated fat:
Sat. Fat
0.723 g
Monounsaturated fat:
Mono. Fat
0.418 g
Polyunsaturated fat:
Poly. Fat
0.182 g
Contains
more
Mono. Fat Monounsaturated fat
+2604.5%
Contains
more
Poly. Fat Polyunsaturated fat
+455.5%
Contains
less
Sat. Fat Saturated fat
-93.3%