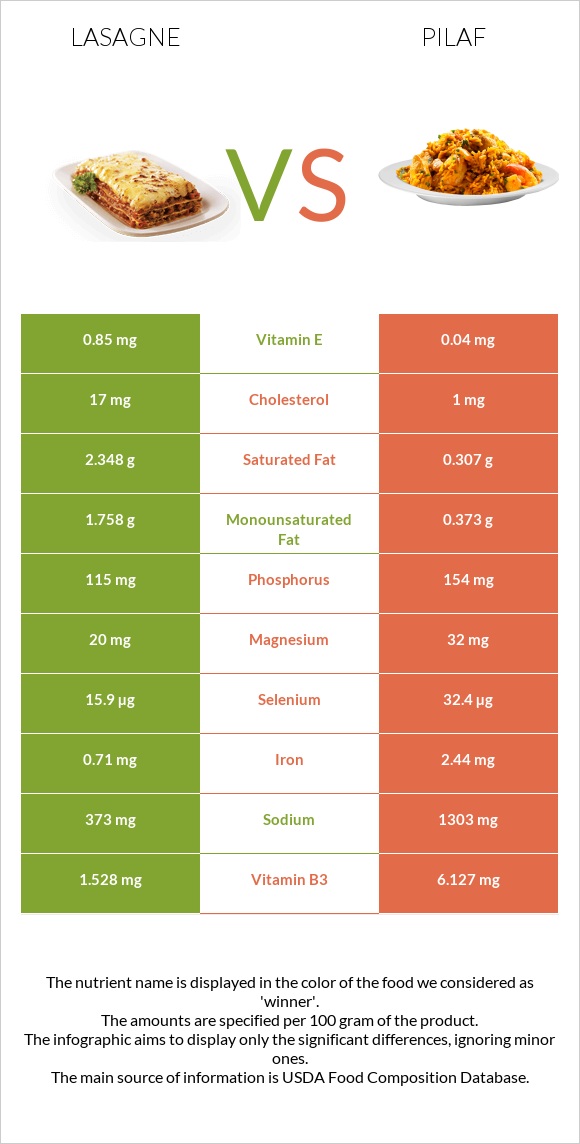
How are lasagne and pilaf different? Lasagne is higher in vitamin B12; however, pilaf is richer in folate, vitamin B1, selenium, manganese, vitamin B3, iron, and vitamin B6. Daily need coverage for folate for pilaf is 47% higher. Lasagne contains 17 times more vitamin B12 than pilaf. While lasagne contains 0.33µg of vitamin B12, pilaf contains only 0.02µg. Pilaf has less saturated fat. Lasagne has a lower glycemic index (28) than pilaf (60). Lasagna with meat sauce, frozen, prepared and Rice and vermicelli mix, rice pilaf flavor, unprepared are the varieties used in this article.
Infographic
Mineral Comparison
Mineral comparison score is based on the number of minerals by which one or the other food is richer. The "coverage" charts below show how much of the daily needs can be covered by 300 grams of the food.
1
100 g
300 g
1 piece corner - 114g 1 piece side - 123g 1 piece center - 255g
Magnesium
Magnesium
Calcium
Calcium
Potassium
Potassium
Iron
Iron
Copper
Copper
Zinc
Zinc
Phosphorus
Phosphorus
Sodium
Sodium
Manganese
Manganese
Selenium
Selenium
14%
26%
17%
27%
30%
24%
49%
49%
25%
87%
7
100 g
300 g
1 tbsp - 9.6g 0.333 cup - 68g
Magnesium
Magnesium
Calcium
Calcium
Potassium
Potassium
Iron
Iron
Copper
Copper
Zinc
Zinc
Phosphorus
Phosphorus
Sodium
Sodium
Manganese
Manganese
Selenium
Selenium
23%
25%
17%
92%
55%
28%
66%
170%
115%
177%
Vitamin Comparison
Vitamin comparison score is based on the number of vitamins by which one or the other food is richer. The "coverage" charts below show how much of the daily needs can be covered by 300 grams of the food.
4
100 g
300 g
1 piece corner - 114g 1 piece side - 123g 1 piece center - 255g
Vitamin C
Vit. C
Vitamin D
Vit. D
Vitamin A
Vit. A
Vitamin E
Vit. E
Vitamin B1
Vit. B1
Vitamin B2
Vit. B2
Vitamin B3
Vit. B3
Vitamin B5
Vit. B5
Vitamin B6
Vit. B6
Vitamin B12
Vit. B12
Vitamin K
Vit. K
Folate
Folate
8.3%
0%
14%
17%
18%
17%
29%
19%
28%
41%
18%
18%
7
100 g
300 g
1 tbsp - 9.6g 0.333 cup - 68g
Vitamin C
Vit. C
Vitamin D
Vit. D
Vitamin A
Vit. A
Vitamin E
Vit. E
Vitamin B1
Vit. B1
Vitamin B2
Vit. B2
Vitamin B3
Vit. B3
Vitamin B5
Vit. B5
Vitamin B6
Vit. B6
Vitamin B12
Vit. B12
Vitamin K
Vit. K
Folate
Folate
14%
0%
1.3%
0.8%
151%
20%
115%
43%
92%
2.5%
1.3%
159%
All nutrients comparison - raw data values
Nutrient
DV% diff.
Folate
24µg
212µg
47%
Vitamin B1
0.07mg
0.603mg
44%
Sodium
373mg
1303mg
40%
Manganese
0.193mg
0.882mg
30%
Selenium
15.9µg
32.4µg
30%
Vitamin B3
1.528mg
6.127mg
29%
Starch
9.83g
71.23g
25%
Iron
0.71mg
2.44mg
22%
Vitamin B6
0.122mg
0.4mg
21%
Carbs
15.36g
76.31g
20%
Vitamin B12
0.33µg
0.02µg
13%
Calories
135kcal
359kcal
11%
Saturated fat
2.348g
0.307g
9%
Copper
0.09mg
0.166mg
8%
Vitamin B5
0.323mg
0.715mg
8%
Protein
7.28g
10.42g
6%
Phosphorus
115mg
154mg
6%
Fats
4.92g
1.37g
5%
Cholesterol
17mg
1mg
5%
Vitamin E
0.85mg
0.04mg
5%
Vitamin K
7µg
0.5µg
5%
Vitamin A
41µg
4µg
4%
Magnesium
20mg
32mg
3%
Monounsaturated fat
1.758g
0.373g
3%
Vitamin C
2.5mg
4.1mg
2%
Fiber
1.7g
1.2g
2%
Calcium
88mg
83mg
1%
Zinc
0.87mg
1.01mg
1%
Vitamin B2
0.074mg
0.087mg
1%
Choline
23.2mg
17.5mg
1%
Fructose
1.04g
0g
1%
Protein per 100 calories
5.4g
2.9g
N/A
Calories per 10 g protein
185kcal
345kcal
N/A
Weight per 100 calories
74g
28g
N/A
Unsaturated / Saturated Fat ratio
0.93
2.4
N/A
Net carbs
13.66g
75.11g
N/A
Vitamin D*
1 IU
0 IU
0%
Potassium
196mg
188mg
0%
Sugar
3.11g
1.53g
N/A
Trans fat
0.196g
0g
N/A
Polyunsaturated fat
0.433g
0.377g
0%
Tryptophan
0.085mg
0.086mg
0%
Threonine
0.219mg
0.221mg
0%
Isoleucine
0.224mg
0.279mg
0%
Leucine
0.578mg
0.523mg
0%
Lysine
0.486mg
0.189mg
0%
Methionine
0.164mg
0.145mg
0%
Phenylalanine
0.329mg
0.32mg
0%
Valine
0.285mg
0.374mg
0%
Histidine
0.183mg
0.15mg
0%
Omega-3 - EPA
0.001g
0g
N/A
Omega-3 - ALA
0.026g
N/A
Omega-3 - DPA
0.003g
0g
N/A
Omega-6 - Dihomo-gamma-linoleic acid
0.006g
N/A
Omega-6 - Eicosadienoic acid
0.005g
0g
N/A
Omega-6 - Linoleic acid
0.322g
N/A
Macronutrient Comparison
Macronutrient breakdown side-by-side comparison
2
7%
5%
15%
71%
Protein:
7.28 g
Fats:
4.92 g
Carbs:
15.36 g
Water:
70.87 g
Other:
1.57 g
3
10%
76%
8%
4%
Protein:
10.42 g
Fats:
1.37 g
Carbs:
76.31 g
Water:
8.04 g
Other:
3.86 g
Contains
more
Fats Fats
+259.1%
Contains
more
Water Water
+781.5%
Contains
more
Protein Protein
+43.1%
Contains
more
Carbs Carbs
+396.8%
Contains
more
Other Other
+145.9%
Fat Type Comparison
Fat type breakdown side-by-side comparison
2
52%
39%
10%
Saturated fat:
Sat. Fat
2.348 g
Monounsaturated fat:
Mono. Fat
1.758 g
Polyunsaturated fat:
Poly. Fat
0.433 g
1
29%
35%
36%
Saturated fat:
Sat. Fat
0.307 g
Monounsaturated fat:
Mono. Fat
0.373 g
Polyunsaturated fat:
Poly. Fat
0.377 g
Contains
more
Mono. Fat Monounsaturated fat
+371.3%
Contains
more
Poly. Fat Polyunsaturated fat
+14.9%
Contains
less
Sat. Fat Saturated fat
-86.9%
Carbohydrate type comparison
Carbohydrate type breakdown side-by-side comparison
4
76%
4%
7%
8%
5%
Starch:
9.83 g
Sucrose:
0.54 g
Glucose:
0.93 g
Fructose:
1.04 g
Lactose:
0.6 g
Maltose:
0 g
Galactose:
0 g
2
98%
Starch:
71.23 g
Sucrose:
0.3 g
Glucose:
0.1 g
Fructose:
0 g
Lactose:
0 g
Maltose:
1.13 g
Galactose:
0 g
Contains
more
Sucrose Sucrose
+80%
Contains
more
Glucose Glucose
+830%
Contains
more
Fructose Fructose
+∞%
Contains
more
Lactose Lactose
+∞%
Contains
more
Starch Starch
+624.6%
Contains
more
Maltose Maltose
+∞%