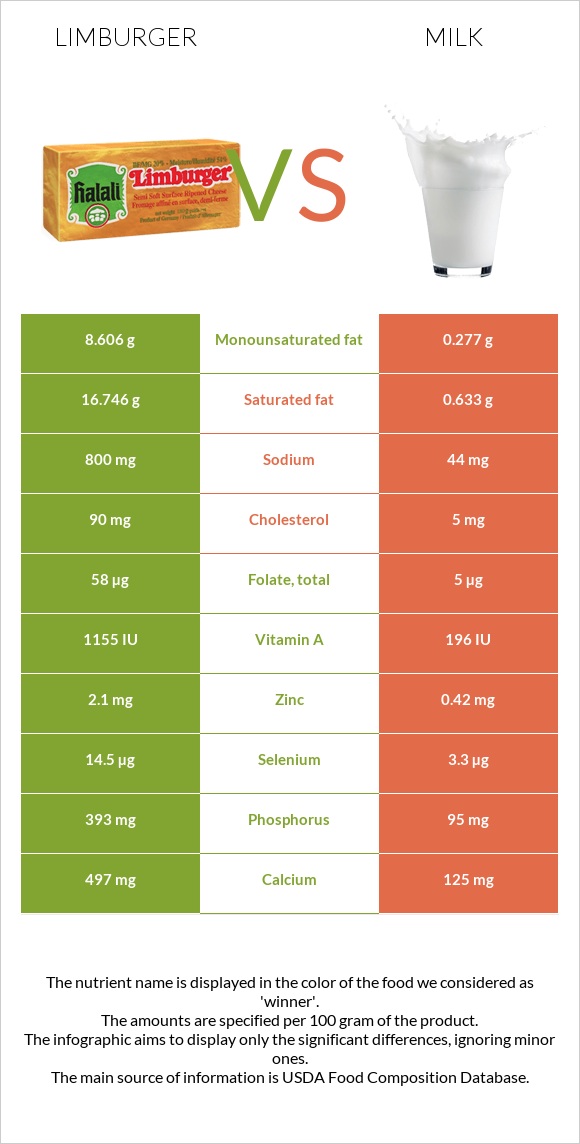
What are the main differences between Limburger and milk? Milk has less phosphorus, calcium, vitamin B2, vitamin B12, selenium, vitamin A, and vitamin B5 than Limburger. Limburger's daily need coverage for saturated fat is 81% higher. Limburger has 18 times more sodium than milk. Limburger has 800mg of sodium, while milk has 44mg. Milk contains less saturated fat. We used Cheese, limburger and Milk, lowfat, fluid, 1% milkfat, with added vitamin A and vitamin D types in this comparison.
Infographic
Mineral Comparison
Mineral comparison score is based on the number of minerals by which one or the other food is richer. The "coverage" charts below show how much of the daily needs can be covered by 300 grams of the food.
8
100 g
300 g
1 cubic inch - 18g 1 oz - 28.35g 1 box - 113g 1 cup - 134g 1 package (8 oz) - 227g
Magnesium
Magnesium
Calcium
Calcium
Potassium
Potassium
Iron
Iron
Copper
Copper
Zinc
Zinc
Phosphorus
Phosphorus
Sodium
Sodium
Manganese
Manganese
Selenium
Selenium
15%
149%
11%
4.9%
7%
57%
168%
104%
5%
79%
2
100 g
300 g
1 fl oz - 30.5g 1 cup - 244g 1 quart - 976g
Magnesium
Magnesium
Calcium
Calcium
Potassium
Potassium
Iron
Iron
Copper
Copper
Zinc
Zinc
Phosphorus
Phosphorus
Sodium
Sodium
Manganese
Manganese
Selenium
Selenium
7.9%
38%
13%
1.1%
3.3%
11%
41%
5.7%
0.39%
18%
Vitamin Comparison
Vitamin comparison score is based on the number of vitamins by which one or the other food is richer. The "coverage" charts below show how much of the daily needs can be covered by 300 grams of the food.
10
100 g
300 g
1 cubic inch - 18g 1 oz - 28.35g 1 box - 113g 1 cup - 134g 1 package (8 oz) - 227g
Vitamin C
Vit. C
Vitamin D
Vit. D
Vitamin A
Vit. A
Vitamin E
Vit. E
Vitamin B1
Vit. B1
Vitamin B2
Vit. B2
Vitamin B3
Vit. B3
Vitamin B5
Vit. B5
Vitamin B6
Vit. B6
Vitamin B12
Vit. B12
Vitamin K
Vit. K
Folate
Folate
0%
7.5%
113%
4.6%
20%
116%
3%
71%
20%
130%
5.8%
44%
1
100 g
300 g
1 fl oz - 30.5g 1 cup - 244g 1 quart - 976g
Vitamin C
Vit. C
Vitamin D
Vit. D
Vitamin A
Vit. A
Vitamin E
Vit. E
Vitamin B1
Vit. B1
Vitamin B2
Vit. B2
Vitamin B3
Vit. B3
Vitamin B5
Vit. B5
Vitamin B6
Vit. B6
Vitamin B12
Vit. B12
Vitamin K
Vit. K
Folate
Folate
0%
18%
19%
0.2%
5%
43%
1.7%
22%
8.5%
59%
0.25%
3.8%
All nutrients comparison - raw data values
Nutrient
DV% diff.
Saturated fat
16.746g
0.633g
73%
Phosphorus
393mg
95mg
43%
Fats
27.25g
0.97g
40%
Calcium
497mg
125mg
37%
Protein
20.05g
3.37g
33%
Sodium
800mg
44mg
33%
Vitamin A
340µg
58µg
31%
Cholesterol
90mg
5mg
28%
Vitamin B2
0.503mg
0.185mg
24%
Vitamin B12
1.04µg
0.47µg
24%
Monounsaturated fat
8.606g
0.277g
21%
Selenium
14.5µg
3.3µg
20%
Vitamin B5
1.177mg
0.361mg
16%
Zinc
2.1mg
0.42mg
15%
Calories
327kcal
42kcal
14%
Folate
58µg
5µg
13%
Vitamin B1
0.08mg
0.02mg
5%
Vitamin D*
20 IU
48 IU
4%
Vitamin D
0.5µg
1.2µg
4%
Vitamin B6
0.086mg
0.037mg
4%
Polyunsaturated fat
0.495g
0.035g
3%
Carbs
0.49g
4.99g
2%
Magnesium
21mg
11mg
2%
Manganese
0.038mg
0.003mg
2%
Vitamin K
2.3µg
0.1µg
2%
Potassium
128mg
150mg
1%
Iron
0.13mg
0.03mg
1%
Copper
0.021mg
0.01mg
1%
Vitamin E
0.23mg
0.01mg
1%
Protein per 100 calories
6.1g
8g
N/A
Calories per 10 g protein
163kcal
125kcal
N/A
Weight per 100 calories
31g
238g
N/A
Unsaturated / Saturated Fat ratio
0.54
0.49
N/A
Net carbs
0.49g
4.99g
N/A
Sugar
0.49g
5.2g
N/A
Vitamin B3
0.158mg
0.093mg
0%
Choline
15.4mg
17.7mg
0%
Tryptophan
0.289mg
0.043mg
0%
Threonine
0.739mg
0.143mg
0%
Isoleucine
1.219mg
0.174mg
0%
Leucine
2.093mg
0.319mg
0%
Lysine
1.675mg
0.282mg
0%
Methionine
0.619mg
0.088mg
0%
Phenylalanine
1.116mg
0.174mg
0%
Valine
1.439mg
0.22mg
0%
Histidine
0.578mg
0.101mg
0%
Omega-3 - ALA
0.004g
N/A
Omega-6 - Linoleic acid
0.027g
N/A
Macronutrient Comparison
Macronutrient breakdown side-by-side comparison
3
20%
27%
48%
4%
Protein:
20.05 g
Fats:
27.25 g
Carbs:
0.49 g
Water:
48.42 g
Other:
3.79 g
2
3%
5%
90%
Protein:
3.37 g
Fats:
0.97 g
Carbs:
4.99 g
Water:
89.92 g
Other:
0.75 g
Contains
more
Protein Protein
+495%
Contains
more
Fats Fats
+2709.3%
Contains
more
Other Other
+405.3%
Contains
more
Carbs Carbs
+918.4%
Contains
more
Water Water
+85.7%
Fat Type Comparison
Fat type breakdown side-by-side comparison
2
65%
33%
2%
Saturated fat:
Sat. Fat
16.746 g
Monounsaturated fat:
Mono. Fat
8.606 g
Polyunsaturated fat:
Poly. Fat
0.495 g
1
67%
29%
4%
Saturated fat:
Sat. Fat
0.633 g
Monounsaturated fat:
Mono. Fat
0.277 g
Polyunsaturated fat:
Poly. Fat
0.035 g
Contains
more
Mono. Fat Monounsaturated fat
+3006.9%
Contains
more
Poly. Fat Polyunsaturated fat
+1314.3%
Contains
less
Sat. Fat Saturated fat
-96.2%