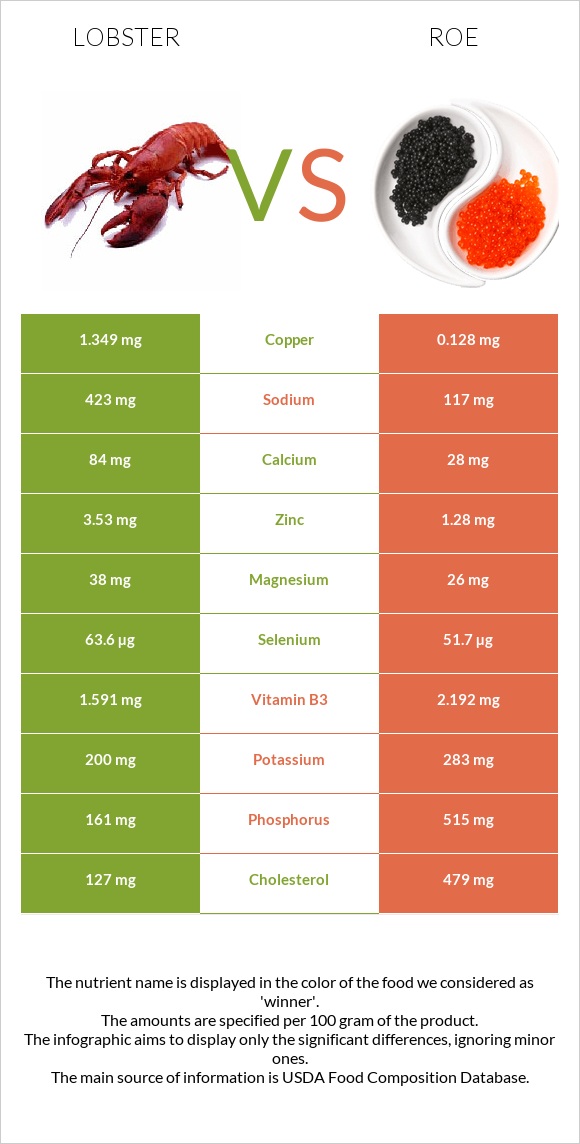
A recap on the differences between lobster and roe Lobster is higher in copper, selenium, and zinc, yet roe is higher in vitamin B12, vitamin B2, phosphorus, vitamin B1, folate, and vitamin C. Roe covers your daily vitamin B12 needs 421% more than lobster. Lobster contains 12 times more copper than roe. While lobster contains 1.55mg of copper, roe contains only 0.128mg. The amount of cholesterol in lobster is lower. The glycemic index of lobster is lower. Food varieties used in this article are Crustaceans, lobster, northern, cooked, moist heat and Fish, roe, mixed species, cooked, dry heat .
Infographic
Mineral Comparison
Mineral comparison score is based on the number of minerals by which one or the other food is richer. The "coverage" charts below show how much of the daily needs can be covered by 300 grams of the food.
6
100 g
300 g
3 oz - 85g 1 cup - 145g
Magnesium
Magnesium
Calcium
Calcium
Potassium
Potassium
Iron
Iron
Copper
Copper
Zinc
Zinc
Phosphorus
Phosphorus
Sodium
Sodium
Manganese
Manganese
Selenium
Selenium
31%
29%
20%
11%
517%
110%
79%
63%
8.5%
399%
4
100 g
300 g
1 oz - 28.35g 3 oz - 85g
Magnesium
Magnesium
Calcium
Calcium
Potassium
Potassium
Iron
Iron
Copper
Copper
Zinc
Zinc
Phosphorus
Phosphorus
Sodium
Sodium
Manganese
Manganese
Selenium
Selenium
19%
8.4%
25%
29%
43%
35%
221%
15%
1.7%
282%
Vitamin Comparison
Vitamin comparison score is based on the number of vitamins by which one or the other food is richer. The "coverage" charts below show how much of the daily needs can be covered by 300 grams of the food.
2
100 g
300 g
3 oz - 85g 1 cup - 145g
Vitamin C
Vit. C
Vitamin D
Vit. D
Vitamin A
Vit. A
Vitamin E
Vit. E
Vitamin B1
Vit. B1
Vitamin B2
Vit. B2
Vitamin B3
Vit. B3
Vitamin B5
Vit. B5
Vitamin B6
Vit. B6
Vitamin B12
Vit. B12
Vitamin K
Vit. K
Folate
Folate
0%
0%
0.33%
20%
5.8%
3.9%
34%
100%
27%
179%
0%
8.3%
8
100 g
300 g
1 oz - 28.35g 3 oz - 85g
Vitamin C
Vit. C
Vitamin D
Vit. D
Vitamin A
Vit. A
Vitamin E
Vit. E
Vitamin B1
Vit. B1
Vitamin B2
Vit. B2
Vitamin B3
Vit. B3
Vitamin B5
Vit. B5
Vitamin B6
Vit. B6
Vitamin B12
Vit. B12
Vitamin K
Vit. K
Folate
Folate
55%
0%
30%
0%
69%
219%
41%
69%
43%
1443%
0%
69%
All nutrients comparison - raw data values
Nutrient
DV% diff.
Vitamin B12
1.43µg
11.54µg
421%
Copper
1.55mg
0.128mg
158%
Cholesterol
146mg
479mg
111%
Vitamin B2
0.017mg
0.949mg
72%
Phosphorus
185mg
515mg
47%
Selenium
73.1µg
51.7µg
39%
Zinc
4.05mg
1.28mg
25%
Vitamin B1
0.023mg
0.277mg
21%
Folate
11µg
92µg
20%
Polyunsaturated fat
0.34g
3.404g
20%
Protein
19g
28.62g
19%
Vitamin C
0mg
16.4mg
18%
Sodium
486mg
117mg
16%
Choline
80.9mg
15%
Fats
0.86g
8.23g
11%
Vitamin A
1µg
91µg
10%
Vitamin B5
1.667mg
1.154mg
10%
Saturated fat
0.208g
1.866g
8%
Calcium
96mg
28mg
7%
Vitamin E
1mg
7%
Calories
89kcal
204kcal
6%
Iron
0.29mg
0.77mg
6%
Vitamin B6
0.119mg
0.185mg
5%
Monounsaturated fat
0.253g
2.129g
5%
Magnesium
43mg
26mg
4%
Potassium
230mg
283mg
2%
Manganese
0.065mg
0.013mg
2%
Vitamin B3
1.83mg
2.192mg
2%
Carbs
0g
1.92g
1%
Protein per 100 calories
21g
14g
N/A
Calories per 10 g protein
47kcal
71kcal
N/A
Weight per 100 calories
112g
49g
N/A
Unsaturated / Saturated Fat ratio
2.9
3
N/A
Net carbs
0g
1.92g
N/A
Vitamin D*
1 IU
0%
Trans fat
0.013g
N/A
Tryptophan
0.248mg
0.375mg
0%
Threonine
0.753mg
1.305mg
0%
Isoleucine
0.832mg
1.465mg
0%
Leucine
1.376mg
2.509mg
0%
Lysine
1.426mg
2.179mg
0%
Methionine
0.475mg
0.71mg
0%
Phenylalanine
0.782mg
1.401mg
0%
Valine
0.852mg
1.676mg
0%
Histidine
0.475mg
0.778mg
0%
Omega-3 - EPA
0.117g
1.26g
N/A
Omega-3 - DHA
0.078g
1.747g
N/A
Omega-3 - ALA
0.05g
N/A
Omega-3 - DPA
0.006g
0.105g
N/A
Omega-3 - Eicosatrienoic acid
0.006g
N/A
Omega-6 - Dihomo-gamma-linoleic acid
0.006g
N/A
Omega-6 - Eicosadienoic acid
0.006g
N/A
Omega-6 - Linoleic acid
0.033g
N/A
Macronutrient Comparison
Macronutrient breakdown side-by-side comparison
1
19%
78%
2%
Protein:
19 g
Fats:
0.86 g
Carbs:
0 g
Water:
78.11 g
Other:
2.03 g
4
29%
8%
2%
59%
3%
Protein:
28.62 g
Fats:
8.23 g
Carbs:
1.92 g
Water:
58.63 g
Other:
2.6 g
Contains
more
Water Water
+33.2%
Contains
more
Protein Protein
+50.6%
Contains
more
Fats Fats
+857%
Contains
more
Carbs Carbs
+∞%
Contains
more
Other Other
+28.1%
Fat Type Comparison
Fat type breakdown side-by-side comparison
1
26%
32%
42%
Saturated fat:
Sat. Fat
0.208 g
Monounsaturated fat:
Mono. Fat
0.253 g
Polyunsaturated fat:
Poly. Fat
0.34 g
2
25%
29%
46%
Saturated fat:
Sat. Fat
1.866 g
Monounsaturated fat:
Mono. Fat
2.129 g
Polyunsaturated fat:
Poly. Fat
3.404 g
Contains
less
Sat. Fat Saturated fat
-88.9%
Contains
more
Mono. Fat Monounsaturated fat
+741.5%
Contains
more
Poly. Fat Polyunsaturated fat
+901.2%