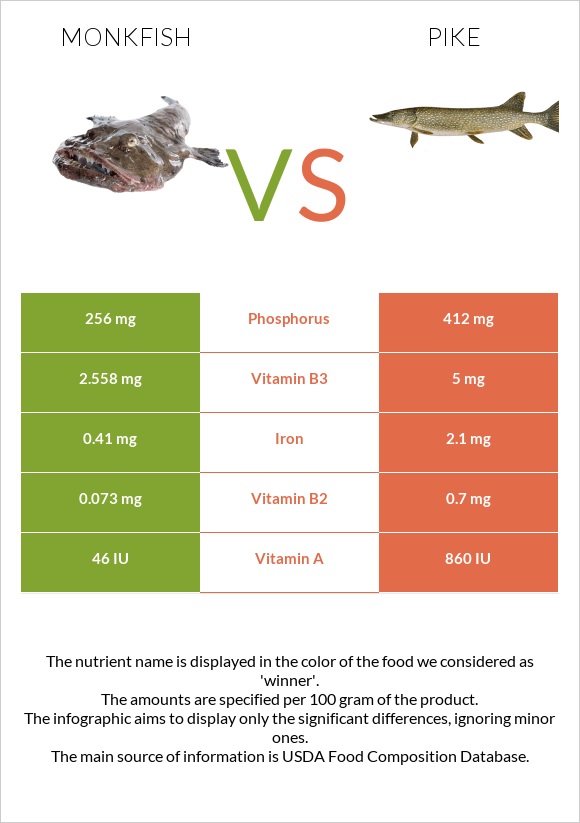
Summary of differences between monkfish and pike The amount of vitamin B2, phosphorus, iron, vitamin A, vitamin B3, and vitamin B1 in pike is higher than in monkfish. Pike covers your daily need for vitamin B2, 48% more than monkfish. These are the specific foods used in this comparison Fish, monkfish, cooked, dry heat and Fish, pike, northern, liver (Alaska Native) .
Infographic
Mineral Comparison
Mineral comparison score is based on the number of minerals by which one or the other food is richer. The "coverage" charts below show how much of the daily needs can be covered by 300 grams of the food.
6
100 g
300 g
3 oz - 85g
Magnesium
Magnesium
Calcium
Calcium
Potassium
Potassium
Iron
Iron
Copper
Copper
Zinc
Zinc
Phosphorus
Phosphorus
Sodium
Sodium
Manganese
Manganese
Selenium
Selenium
19%
3%
45%
15%
12%
14%
110%
3%
4%
255%
4
100 g
300 g
Magnesium
Magnesium
Calcium
Calcium
Potassium
Potassium
Iron
Iron
Copper
Copper
Zinc
Zinc
Phosphorus
Phosphorus
Sodium
Sodium
Manganese
Manganese
Selenium
Selenium
0%
8.4%
0%
79%
0%
0%
177%
0%
0%
0%
Vitamin Comparison
Vitamin comparison score is based on the number of vitamins by which one or the other food is richer. The "coverage" charts below show how much of the daily needs can be covered by 300 grams of the food.
6
100 g
300 g
3 oz - 85g
Vitamin C
Vit. C
Vitamin D
Vit. D
Vitamin A
Vit. A
Vitamin E
Vit. E
Vitamin B1
Vit. B1
Vitamin B2
Vit. B2
Vitamin B3
Vit. B3
Vitamin B5
Vit. B5
Vitamin B6
Vit. B6
Vitamin B12
Vit. B12
Vitamin K
Vit. K
Folate
Folate
3.3%
0%
4.7%
0%
7.3%
17%
48%
10%
64%
130%
0%
6%
3
100 g
300 g
Vitamin C
Vit. C
Vitamin D
Vit. D
Vitamin A
Vit. A
Vitamin E
Vit. E
Vitamin B1
Vit. B1
Vitamin B2
Vit. B2
Vitamin B3
Vit. B3
Vitamin B5
Vit. B5
Vitamin B6
Vit. B6
Vitamin B12
Vit. B12
Vitamin K
Vit. K
Folate
Folate
0%
0%
0%
0%
25%
162%
94%
0%
0%
0%
0%
0%
All nutrients comparison - raw data values
Nutrient
DV% diff.
Selenium
46.8µg
85%
Vitamin B2
0.073mg
0.7mg
48%
Vitamin B12
1.04µg
43%
Phosphorus
256mg
412mg
22%
Iron
0.41mg
2.1mg
21%
Vitamin B6
0.277mg
21%
Potassium
513mg
15%
Vitamin B3
2.558mg
5mg
15%
Cholesterol
32mg
11%
Fats
1.95g
8g
9%
Magnesium
27mg
6%
Vitamin B1
0.029mg
0.1mg
6%
Zinc
0.53mg
5%
Protein
18.56g
16.6g
4%
Copper
0.036mg
4%
Calories
97kcal
156kcal
3%
Vitamin B5
0.173mg
3%
Calcium
10mg
28mg
2%
Vitamin A
14µg
2%
Folate
8µg
2%
Vitamin C
1mg
1%
Carbs
0g
4.3g
1%
Sodium
23mg
1%
Manganese
0.031mg
1%
Protein per 100 calories
19g
11g
N/A
Calories per 10 g protein
52kcal
94kcal
N/A
Weight per 100 calories
103g
64g
N/A
Net carbs
0g
4.3g
N/A
Tryptophan
0.208mg
0%
Threonine
0.814mg
0%
Isoleucine
0.855mg
0%
Leucine
1.509mg
0%
Lysine
1.705mg
0%
Methionine
0.549mg
0%
Phenylalanine
0.725mg
0%
Valine
0.956mg
0%
Histidine
0.547mg
0%
Macronutrient Comparison
Macronutrient breakdown side-by-side comparison
2
19%
2%
79%
Protein:
18.56 g
Fats:
1.95 g
Carbs:
0 g
Water:
78.51 g
Other:
0.98 g
3
17%
8%
4%
70%
Protein:
16.6 g
Fats:
8 g
Carbs:
4.3 g
Water:
69.8 g
Other:
1.3 g
Contains
more
Protein Protein
+11.8%
Contains
more
Water Water
+12.5%
Contains
more
Fats Fats
+310.3%
Contains
more
Carbs Carbs
+∞%
Contains
more
Other Other
+32.7%