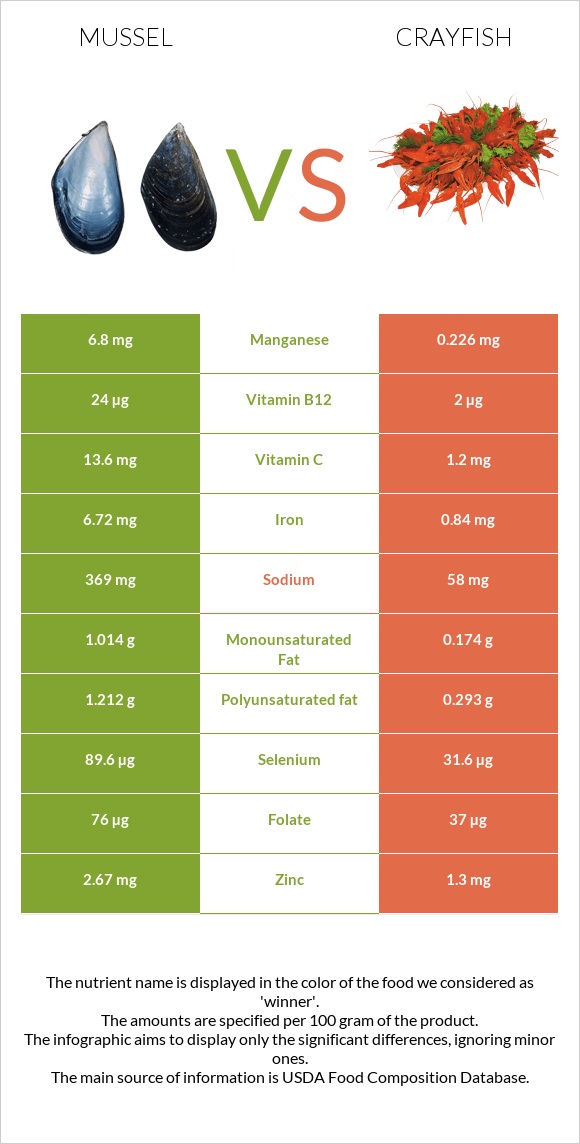
Differences between mussels and crayfish Mussels has more vitamin B12, manganese, selenium, iron, vitamin B2, vitamin B1, and vitamin C, while crayfish has more copper. Mussels's daily need coverage for vitamin B12 is 910% higher. Crayfish contains 15 times less vitamin C than mussels. Mussels contains 13.6mg of vitamin C, while crayfish contains 0.9mg. The amount of sodium in crayfish is lower. Crayfish has a lower glycemic index. The glycemic index of crayfish is 0, while the glycemic index of mussels is 50. The food types used in this comparison are Mollusks, mussel, blue, cooked, moist heat and Crustaceans, crayfish, mixed species, wild, cooked, moist heat .
Infographic
Mineral Comparison
Mineral comparison score is based on the number of minerals by which one or the other food is richer. The "coverage" charts below show how much of the daily needs can be covered by 300 grams of the food.
5
100 g
300 g
3 oz - 85g
Magnesium
Magnesium
Calcium
Calcium
Potassium
Potassium
Iron
Iron
Copper
Copper
Zinc
Zinc
Phosphorus
Phosphorus
Sodium
Sodium
Manganese
Manganese
Selenium
Selenium
26%
9.9%
24%
252%
50%
73%
122%
48%
887%
489%
4
100 g
300 g
3 oz - 85g
Magnesium
Magnesium
Calcium
Calcium
Potassium
Potassium
Iron
Iron
Copper
Copper
Zinc
Zinc
Phosphorus
Phosphorus
Sodium
Sodium
Manganese
Manganese
Selenium
Selenium
24%
18%
26%
31%
228%
48%
116%
12%
68%
200%
Vitamin Comparison
Vitamin comparison score is based on the number of vitamins by which one or the other food is richer. The "coverage" charts below show how much of the daily needs can be covered by 300 grams of the food.
9
100 g
300 g
3 oz - 85g
Vitamin C
Vit. C
Vitamin D
Vit. D
Vitamin A
Vit. A
Vitamin E
Vit. E
Vitamin B1
Vit. B1
Vitamin B2
Vit. B2
Vitamin B3
Vit. B3
Vitamin B5
Vit. B5
Vitamin B6
Vit. B6
Vitamin B12
Vit. B12
Vitamin K
Vit. K
Folate
Folate
45%
0%
30%
0%
75%
97%
56%
57%
23%
3000%
0%
57%
2
100 g
300 g
3 oz - 85g
Vitamin C
Vit. C
Vitamin D
Vit. D
Vitamin A
Vit. A
Vitamin E
Vit. E
Vitamin B1
Vit. B1
Vitamin B2
Vit. B2
Vitamin B3
Vit. B3
Vitamin B5
Vit. B5
Vitamin B6
Vit. B6
Vitamin B12
Vit. B12
Vitamin K
Vit. K
Folate
Folate
3%
0%
5%
30%
13%
20%
43%
35%
18%
269%
0.25%
33%
All nutrients comparison - raw data values
Nutrient
DV% diff.
Vitamin B12
24µg
2.15µg
910%
Manganese
6.8mg
0.522mg
273%
Selenium
89.6µg
36.7µg
96%
Iron
6.72mg
0.83mg
74%
Copper
0.149mg
0.685mg
60%
Cholesterol
56mg
133mg
26%
Vitamin B2
0.42mg
0.085mg
26%
Vitamin B1
0.3mg
0.05mg
21%
Choline
80.9mg
15%
Protein
23.8g
16.77g
14%
Vitamin C
13.6mg
0.9mg
14%
Sodium
369mg
94mg
12%
Vitamin E
1.5mg
10%
Zinc
2.67mg
1.76mg
8%
Vitamin A
91µg
15µg
8%
Folate
76µg
44µg
8%
Vitamin B5
0.95mg
0.58mg
7%
Polyunsaturated fat
1.212g
0.367g
6%
Calories
172kcal
82kcal
5%
Fats
4.48g
1.2g
5%
Vitamin B3
3mg
2.28mg
5%
Calcium
33mg
60mg
3%
Saturated fat
0.85g
0.181g
3%
Carbs
7.39g
0g
2%
Phosphorus
285mg
270mg
2%
Vitamin B6
0.1mg
0.076mg
2%
Monounsaturated fat
1.014g
0.244g
2%
Magnesium
37mg
33mg
1%
Potassium
268mg
296mg
1%
Protein per 100 calories
14g
20g
N/A
Calories per 10 g protein
72kcal
49kcal
N/A
Weight per 100 calories
58g
122g
N/A
Unsaturated / Saturated Fat ratio
2.6
3.4
N/A
Net carbs
7.39g
0g
N/A
Vitamin K
0.1µg
0%
Tryptophan
0.267mg
0.234mg
0%
Threonine
1.025mg
0.676mg
0%
Isoleucine
1.036mg
0.811mg
0%
Leucine
1.676mg
1.329mg
0%
Lysine
1.779mg
1.457mg
0%
Methionine
0.537mg
0.472mg
0%
Phenylalanine
0.853mg
0.706mg
0%
Valine
1.04mg
0.786mg
0%
Histidine
0.457mg
0.341mg
0%
Omega-3 - EPA
0.276g
0.119g
N/A
Omega-3 - DHA
0.506g
0.047g
N/A
Omega-3 - DPA
0.044g
0g
N/A
Macronutrient Comparison
Macronutrient breakdown side-by-side comparison
4
24%
4%
7%
61%
3%
Protein:
23.8 g
Fats:
4.48 g
Carbs:
7.39 g
Water:
61.15 g
Other:
3.18 g
1
17%
79%
3%
Protein:
16.77 g
Fats:
1.2 g
Carbs:
0 g
Water:
79.37 g
Other:
2.66 g
Contains
more
Protein Protein
+41.9%
Contains
more
Fats Fats
+273.3%
Contains
more
Carbs Carbs
+∞%
Contains
more
Other Other
+19.5%
Contains
more
Water Water
+29.8%
Fat Type Comparison
Fat type breakdown side-by-side comparison
2
28%
33%
39%
Saturated fat:
Sat. Fat
0.85 g
Monounsaturated fat:
Mono. Fat
1.014 g
Polyunsaturated fat:
Poly. Fat
1.212 g
1
23%
31%
46%
Saturated fat:
Sat. Fat
0.181 g
Monounsaturated fat:
Mono. Fat
0.244 g
Polyunsaturated fat:
Poly. Fat
0.367 g
Contains
more
Mono. Fat Monounsaturated fat
+315.6%
Contains
more
Poly. Fat Polyunsaturated fat
+230.2%
Contains
less
Sat. Fat Saturated fat
-78.7%