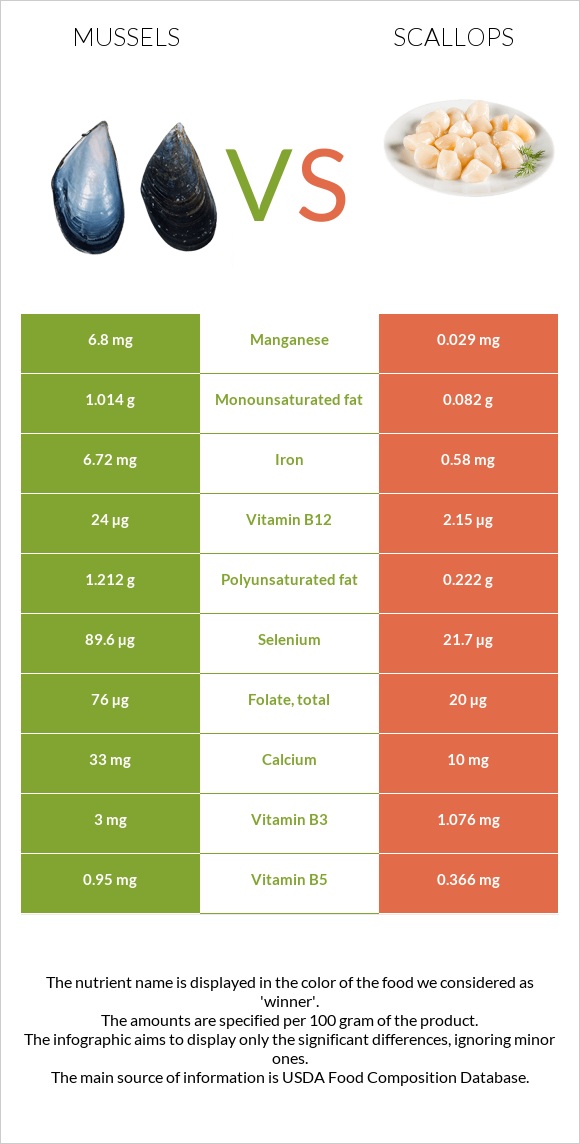
A recap on the differences between mussels and scallops Mussels has more vitamin B12, manganese, selenium, iron, vitamin B2, vitamin B1, vitamin C, and folate; however, scallops are higher in phosphorus. Mussels covers your daily vitamin B12 needs 910% more than scallops. Mussels has less sodium. Food varieties used in this article are Mollusks, mussel, blue, cooked, moist heat and Mollusks, scallop, (bay and sea), cooked, steamed .
Infographic
Mineral Comparison
Mineral comparison score is based on the number of minerals by which one or the other food is richer. The "coverage" charts below show how much of the daily needs can be covered by 300 grams of the food.
7
100 g
300 g
3 oz - 85g
Magnesium
Magnesium
Calcium
Calcium
Potassium
Potassium
Iron
Iron
Copper
Copper
Zinc
Zinc
Phosphorus
Phosphorus
Sodium
Sodium
Manganese
Manganese
Selenium
Selenium
26%
9.9%
24%
252%
50%
73%
122%
48%
887%
489%
2
100 g
300 g
3 oz - 85g
Magnesium
Magnesium
Calcium
Calcium
Potassium
Potassium
Iron
Iron
Copper
Copper
Zinc
Zinc
Phosphorus
Phosphorus
Sodium
Sodium
Manganese
Manganese
Selenium
Selenium
26%
3%
28%
22%
11%
42%
183%
87%
3.8%
118%
Vitamin Comparison
Vitamin comparison score is based on the number of vitamins by which one or the other food is richer. The "coverage" charts below show how much of the daily needs can be covered by 300 grams of the food.
8
100 g
300 g
3 oz - 85g
Vitamin C
Vit. C
Vitamin D
Vit. D
Vitamin A
Vit. A
Vitamin E
Vit. E
Vitamin B1
Vit. B1
Vitamin B2
Vit. B2
Vitamin B3
Vit. B3
Vitamin B5
Vit. B5
Vitamin B6
Vit. B6
Vitamin B12
Vit. B12
Vitamin K
Vit. K
Folate
Folate
45%
0%
30%
0%
75%
97%
56%
57%
23%
3000%
0%
57%
1
100 g
300 g
3 oz - 85g
Vitamin C
Vit. C
Vitamin D
Vit. D
Vitamin A
Vit. A
Vitamin E
Vit. E
Vitamin B1
Vit. B1
Vitamin B2
Vit. B2
Vitamin B3
Vit. B3
Vitamin B5
Vit. B5
Vitamin B6
Vit. B6
Vitamin B12
Vit. B12
Vitamin K
Vit. K
Folate
Folate
0%
0%
0.67%
0%
3%
5.5%
20%
22%
26%
269%
0%
15%
All nutrients comparison - raw data values
Nutrient
DV% diff.
Vitamin B12
24µg
2.15µg
910%
Manganese
6.8mg
0.029mg
294%
Selenium
89.6µg
21.7µg
123%
Iron
6.72mg
0.58mg
77%
Vitamin B2
0.42mg
0.024mg
30%
Vitamin B1
0.3mg
0.012mg
24%
Phosphorus
285mg
426mg
20%
Choline
110.7mg
20%
Vitamin C
13.6mg
0mg
15%
Folate
76µg
20µg
14%
Copper
0.149mg
0.033mg
13%
Sodium
369mg
667mg
13%
Vitamin B3
3mg
1.076mg
12%
Vitamin B5
0.95mg
0.366mg
12%
Zinc
2.67mg
1.55mg
10%
Vitamin A
91µg
2µg
10%
Protein
23.8g
20.54g
7%
Polyunsaturated fat
1.212g
0.222g
7%
Fats
4.48g
0.84g
6%
Cholesterol
56mg
41mg
5%
Calories
172kcal
111kcal
3%
Saturated fat
0.85g
0.218g
3%
Calcium
33mg
10mg
2%
Starch
3.69g
2%
Monounsaturated fat
1.014g
0.082g
2%
Carbs
7.39g
5.41g
1%
Potassium
268mg
314mg
1%
Vitamin B6
0.1mg
0.112mg
1%
Protein per 100 calories
14g
19g
N/A
Calories per 10 g protein
72kcal
54kcal
N/A
Weight per 100 calories
58g
90g
N/A
Unsaturated / Saturated Fat ratio
2.6
1.4
N/A
Net carbs
7.39g
5.41g
N/A
Vitamin D*
2 IU
0%
Magnesium
37mg
37mg
0%
Trans fat
0.009g
N/A
Tryptophan
0.267mg
0.173mg
0%
Threonine
1.025mg
0.629mg
0%
Isoleucine
1.036mg
0.692mg
0%
Leucine
1.676mg
1.226mg
0%
Lysine
1.779mg
1.258mg
0%
Methionine
0.537mg
0.487mg
0%
Phenylalanine
0.853mg
0.597mg
0%
Valine
1.04mg
0.645mg
0%
Histidine
0.457mg
0.314mg
0%
Omega-3 - EPA
0.276g
0.072g
N/A
Omega-3 - DHA
0.506g
0.104g
N/A
Omega-3 - DPA
0.044g
0.005g
N/A
Omega-6 - Eicosadienoic acid
0.002g
N/A
Macronutrient Comparison
Macronutrient breakdown side-by-side comparison
4
24%
4%
7%
61%
3%
Protein:
23.8 g
Fats:
4.48 g
Carbs:
7.39 g
Water:
61.15 g
Other:
3.18 g
1
21%
5%
70%
3%
Protein:
20.54 g
Fats:
0.84 g
Carbs:
5.41 g
Water:
70.25 g
Other:
2.96 g
Contains
more
Protein Protein
+15.9%
Contains
more
Fats Fats
+433.3%
Contains
more
Carbs Carbs
+36.6%
Contains
more
Water Water
+14.9%
Fat Type Comparison
Fat type breakdown side-by-side comparison
2
28%
33%
39%
Saturated fat:
Sat. Fat
0.85 g
Monounsaturated fat:
Mono. Fat
1.014 g
Polyunsaturated fat:
Poly. Fat
1.212 g
1
42%
16%
43%
Saturated fat:
Sat. Fat
0.218 g
Monounsaturated fat:
Mono. Fat
0.082 g
Polyunsaturated fat:
Poly. Fat
0.222 g
Contains
more
Mono. Fat Monounsaturated fat
+1136.6%
Contains
more
Poly. Fat Polyunsaturated fat
+445.9%
Contains
less
Sat. Fat Saturated fat
-74.4%