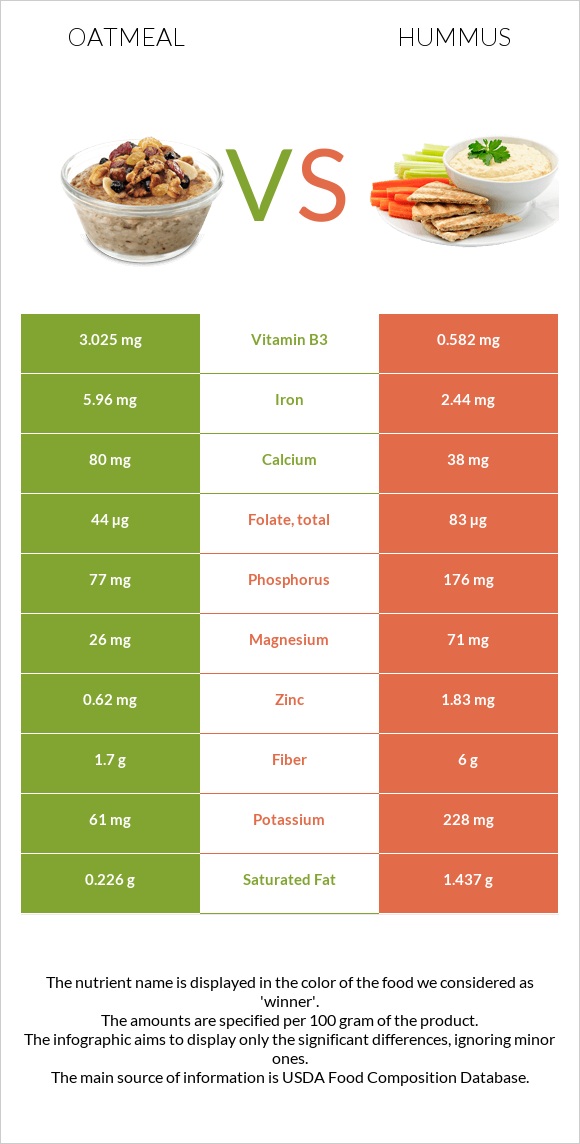
Differences between oatmeal and hummus Oatmeal has more iron, vitamin B3, and vitamin B2, while hummus has more copper, fiber, phosphorus, zinc, magnesium, and folate. Hummus's daily need coverage for copper is 51% higher. Hummus contains 5 times less vitamin B3 than oatmeal. Oatmeal contains 3.025mg of vitamin B3, while hummus contains 0.582mg. The amount of sodium in oatmeal is lower. Hummus has a lower glycemic index. The glycemic index of hummus is 6, while the glycemic index of oatmeal is 79. The food types used in this comparison are Cereals, oats, instant, fortified, plain, prepared with water (boiling water added or microwaved) and Hummus, commercial .
Infographic
Mineral Comparison
Mineral comparison score is based on the number of minerals by which one or the other food is richer. The "coverage" charts below show how much of the daily needs can be covered by 300 grams of the food.
4
100 g
300 g
1 oz, dry, yields - 177g 1 packet, dry, yields - 177g 1 cup, cooked - 234g 1 cup, dry, yields - 501g
Magnesium
Magnesium
Calcium
Calcium
Potassium
Potassium
Iron
Iron
Copper
Copper
Zinc
Zinc
Phosphorus
Phosphorus
Sodium
Sodium
Manganese
Manganese
Selenium
Selenium
19%
24%
5.4%
224%
22%
17%
33%
6.4%
73%
27%
6
100 g
300 g
1 tbsp - 15g 1 cup - 246g
Magnesium
Magnesium
Calcium
Calcium
Potassium
Potassium
Iron
Iron
Copper
Copper
Zinc
Zinc
Phosphorus
Phosphorus
Sodium
Sodium
Manganese
Manganese
Selenium
Selenium
51%
11%
20%
92%
176%
50%
75%
49%
101%
14%
Vitamin Comparison
Vitamin comparison score is based on the number of vitamins by which one or the other food is richer. The "coverage" charts below show how much of the daily needs can be covered by 300 grams of the food.
8
100 g
300 g
1 oz, dry, yields - 177g 1 packet, dry, yields - 177g 1 cup, cooked - 234g 1 cup, dry, yields - 501g
Vitamin C
Vit. C
Vitamin D
Vit. D
Vitamin A
Vit. A
Vitamin E
Vit. E
Vitamin B1
Vit. B1
Vitamin B2
Vit. B2
Vitamin B3
Vit. B3
Vitamin B5
Vit. B5
Vitamin B6
Vit. B6
Vitamin B12
Vit. B12
Vitamin K
Vit. K
Folate
Folate
0%
0%
43%
1.4%
65%
50%
57%
19%
67%
0%
1%
33%
1
100 g
300 g
1 tbsp - 15g 1 cup - 246g
Vitamin C
Vit. C
Vitamin D
Vit. D
Vitamin A
Vit. A
Vitamin E
Vit. E
Vitamin B1
Vit. B1
Vitamin B2
Vit. B2
Vitamin B3
Vit. B3
Vitamin B5
Vit. B5
Vitamin B6
Vit. B6
Vitamin B12
Vit. B12
Vitamin K
Vit. K
Folate
Folate
0%
0%
0%
0%
45%
15%
11%
7.9%
46%
0%
0%
62%
All nutrients comparison - raw data values
Nutrient
DV% diff.
Copper
0.066mg
0.527mg
51%
Iron
5.96mg
2.44mg
44%
Polyunsaturated fat
0.426g
3.613g
21%
Fiber
1.7g
6g
17%
Vitamin B3
3.025mg
0.582mg
15%
Phosphorus
77mg
176mg
14%
Sodium
49mg
379mg
14%
Vitamin A
130µg
14%
Fats
1.36g
9.6g
13%
Vitamin B2
0.215mg
0.064mg
12%
Protein
2.37g
7.9g
11%
Magnesium
26mg
71mg
11%
Zinc
0.62mg
1.83mg
11%
Folate
44µg
83µg
10%
Manganese
0.558mg
0.773mg
9%
Monounsaturated fat
0.391g
4.039g
9%
Vitamin B1
0.26mg
0.18mg
7%
Vitamin B6
0.29mg
0.2mg
7%
Saturated fat
0.226g
1.437g
6%
Calories
68kcal
166kcal
5%
Potassium
61mg
228mg
5%
Calcium
80mg
38mg
4%
Starch
10.37g
4%
Selenium
5µg
2.6µg
4%
Vitamin B5
0.317mg
0.132mg
4%
Carbs
11.67g
14.29g
1%
Choline
4.7mg
1%
Protein per 100 calories
3.5g
4.8g
N/A
Calories per 10 g protein
287kcal
210kcal
N/A
Weight per 100 calories
147g
60g
N/A
Unsaturated / Saturated Fat ratio
3.6
5.3
N/A
Net carbs
9.97g
8.29g
N/A
Sugar
0.46g
N/A
Vitamin E
0.07mg
0%
Vitamin K
0.4µg
0%
Trans fat
0.003g
N/A
Tryptophan
0.04mg
0%
Threonine
0.083mg
0%
Isoleucine
0.105mg
0%
Leucine
0.2mg
0%
Lysine
0.135mg
0%
Methionine
0.04mg
0%
Phenylalanine
0.13mg
0%
Valine
0.151mg
0%
Histidine
0.057mg
0%
Macronutrient Comparison
Macronutrient breakdown side-by-side comparison
1
2%
12%
84%
Protein:
2.37 g
Fats:
1.36 g
Carbs:
11.67 g
Water:
84.03 g
Other:
0.57 g
4
8%
10%
14%
67%
Protein:
7.9 g
Fats:
9.6 g
Carbs:
14.29 g
Water:
66.59 g
Other:
1.62 g
Contains
more
Water Water
+26.2%
Contains
more
Protein Protein
+233.3%
Contains
more
Fats Fats
+605.9%
Contains
more
Carbs Carbs
+22.5%
Contains
more
Other Other
+184.2%
Fat Type Comparison
Fat type breakdown side-by-side comparison
1
22%
37%
41%
Saturated fat:
Sat. Fat
0.226 g
Monounsaturated fat:
Mono. Fat
0.391 g
Polyunsaturated fat:
Poly. Fat
0.426 g
2
16%
44%
40%
Saturated fat:
Sat. Fat
1.437 g
Monounsaturated fat:
Mono. Fat
4.039 g
Polyunsaturated fat:
Poly. Fat
3.613 g
Contains
less
Sat. Fat Saturated fat
-84.3%
Contains
more
Mono. Fat Monounsaturated fat
+933%
Contains
more
Poly. Fat Polyunsaturated fat
+748.1%