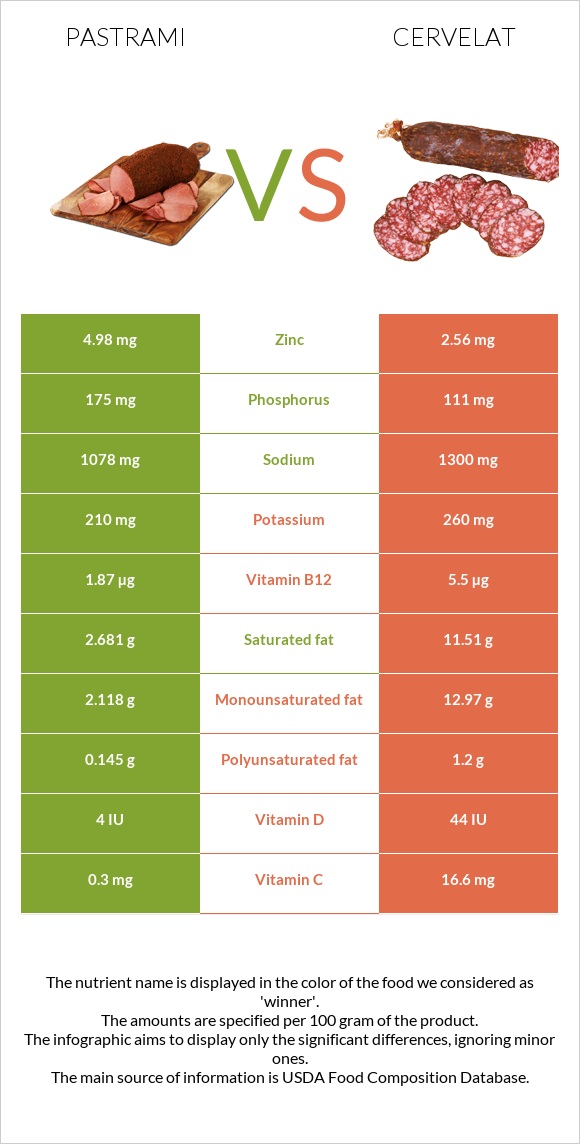
Summary of differences between pastrami and cervelat Pastrami has more zinc and phosphorus; however, cervelat is higher in vitamin B12, vitamin C, vitamin B2, vitamin B1, and copper. Cervelat covers your daily need for vitamin B12, 151% more than pastrami. Pastrami has 2 times more zinc than cervelat. While pastrami has 4.98mg of zinc, cervelat has only 2.56mg. Pastrami has less sodium. The glycemic index of pastrami is higher. These are the specific foods used in this comparison Beef, cured, pastrami and Thuringer, cervelat, summer sausage, beef, pork .
Infographic
Mineral Comparison
Mineral comparison score is based on the number of minerals by which one or the other food is richer. The "coverage" charts below show how much of the daily needs can be covered by 300 grams of the food.
5
100 g
300 g
1 slice (1 oz) - 28g 1 package, 2.5 oz - 71g
Magnesium
Magnesium
Calcium
Calcium
Potassium
Potassium
Iron
Iron
Copper
Copper
Zinc
Zinc
Phosphorus
Phosphorus
Sodium
Sodium
Manganese
Manganese
Selenium
Selenium
12%
3%
19%
83%
30%
136%
75%
141%
3.5%
97%
3
100 g
300 g
2 oz 1 serving - 56g
Magnesium
Magnesium
Calcium
Calcium
Potassium
Potassium
Iron
Iron
Copper
Copper
Zinc
Zinc
Phosphorus
Phosphorus
Sodium
Sodium
Manganese
Manganese
Selenium
Selenium
10%
2.7%
23%
77%
50%
70%
48%
170%
0%
111%
Vitamin Comparison
Vitamin comparison score is based on the number of vitamins by which one or the other food is richer. The "coverage" charts below show how much of the daily needs can be covered by 300 grams of the food.
3
100 g
300 g
1 slice (1 oz) - 28g 1 package, 2.5 oz - 71g
Vitamin C
Vit. C
Vitamin D
Vit. D
Vitamin A
Vit. A
Vitamin E
Vit. E
Vitamin B1
Vit. B1
Vitamin B2
Vit. B2
Vitamin B3
Vit. B3
Vitamin B5
Vit. B5
Vitamin B6
Vit. B6
Vitamin B12
Vit. B12
Vitamin K
Vit. K
Folate
Folate
1%
1.5%
0.67%
2.4%
13%
37%
80%
16%
51%
234%
1.8%
4.5%
8
100 g
300 g
2 oz 1 serving - 56g
Vitamin C
Vit. C
Vitamin D
Vit. D
Vitamin A
Vit. A
Vitamin E
Vit. E
Vitamin B1
Vit. B1
Vitamin B2
Vit. B2
Vitamin B3
Vit. B3
Vitamin B5
Vit. B5
Vitamin B6
Vit. B6
Vitamin B12
Vit. B12
Vitamin K
Vit. K
Folate
Folate
55%
17%
0%
4.4%
38%
76%
81%
0%
60%
688%
3.3%
1.5%
All nutrients comparison - raw data values
Nutrient
DV% diff.
Vitamin B12
1.87µg
5.5µg
151%
Saturated fat
2.681g
11.51g
40%
Fats
5.82g
30.43g
38%
Monounsaturated fat
2.118g
12.97g
27%
Zinc
4.98mg
2.56mg
22%
Vitamin C
0.3mg
16.6mg
18%
Vitamin B2
0.161mg
0.33mg
13%
Calories
147kcal
362kcal
11%
Sodium
1078mg
1300mg
10%
Protein
21.8g
17.45g
9%
Phosphorus
175mg
111mg
9%
Vitamin B1
0.052mg
0.15mg
8%
Copper
0.091mg
0.15mg
7%
Polyunsaturated fat
0.145g
1.2g
7%
Vitamin D*
4 IU
44 IU
5%
Vitamin D
0.1µg
1.1µg
5%
Selenium
17.7µg
20.3µg
5%
Vitamin B5
0.265mg
5%
Vitamin B6
0.221mg
0.26mg
3%
Cholesterol
68mg
74mg
2%
Iron
2.22mg
2.04mg
2%
Carbs
0.36g
3.33g
1%
Magnesium
17mg
14mg
1%
Potassium
210mg
260mg
1%
Vitamin E
0.12mg
0.22mg
1%
Manganese
0.027mg
1%
Vitamin K
0.7µg
1.3µg
1%
Folate
6µg
2µg
1%
Protein per 100 calories
15g
4.8g
N/A
Calories per 10 g protein
67kcal
207kcal
N/A
Weight per 100 calories
68g
28g
N/A
Unsaturated / Saturated Fat ratio
0.84
1.2
N/A
Net carbs
0.36g
3.33g
N/A
Calcium
10mg
9mg
0%
Sugar
0.1g
0.85g
N/A
Vitamin A
2µg
0µg
0%
Vitamin B3
4.26mg
4.31mg
0%
Choline
81.6mg
78.9mg
0%
Tryptophan
0.141mg
0%
Threonine
0.857mg
0%
Isoleucine
0.976mg
0%
Leucine
1.706mg
0%
Lysine
1.812mg
0%
Methionine
0.558mg
0%
Phenylalanine
0.847mg
0%
Valine
1.065mg
0%
Histidine
0.684mg
0%
Fructose
0.01g
0%
Macronutrient Comparison
Macronutrient breakdown side-by-side comparison
2
22%
6%
70%
2%
Protein:
21.8 g
Fats:
5.82 g
Carbs:
0.36 g
Water:
69.53 g
Other:
2.49 g
3
17%
30%
3%
45%
4%
Protein:
17.45 g
Fats:
30.43 g
Carbs:
3.33 g
Water:
45.18 g
Other:
3.61 g
Contains
more
Protein Protein
+24.9%
Contains
more
Water Water
+53.9%
Contains
more
Fats Fats
+422.9%
Contains
more
Carbs Carbs
+825%
Contains
more
Other Other
+45%
Fat Type Comparison
Fat type breakdown side-by-side comparison
1
54%
43%
3%
Saturated fat:
Sat. Fat
2.681 g
Monounsaturated fat:
Mono. Fat
2.118 g
Polyunsaturated fat:
Poly. Fat
0.145 g
2
45%
51%
5%
Saturated fat:
Sat. Fat
11.51 g
Monounsaturated fat:
Mono. Fat
12.97 g
Polyunsaturated fat:
Poly. Fat
1.2 g
Contains
less
Sat. Fat Saturated fat
-76.7%
Contains
more
Mono. Fat Monounsaturated fat
+512.4%
Contains
more
Poly. Fat Polyunsaturated fat
+727.6%