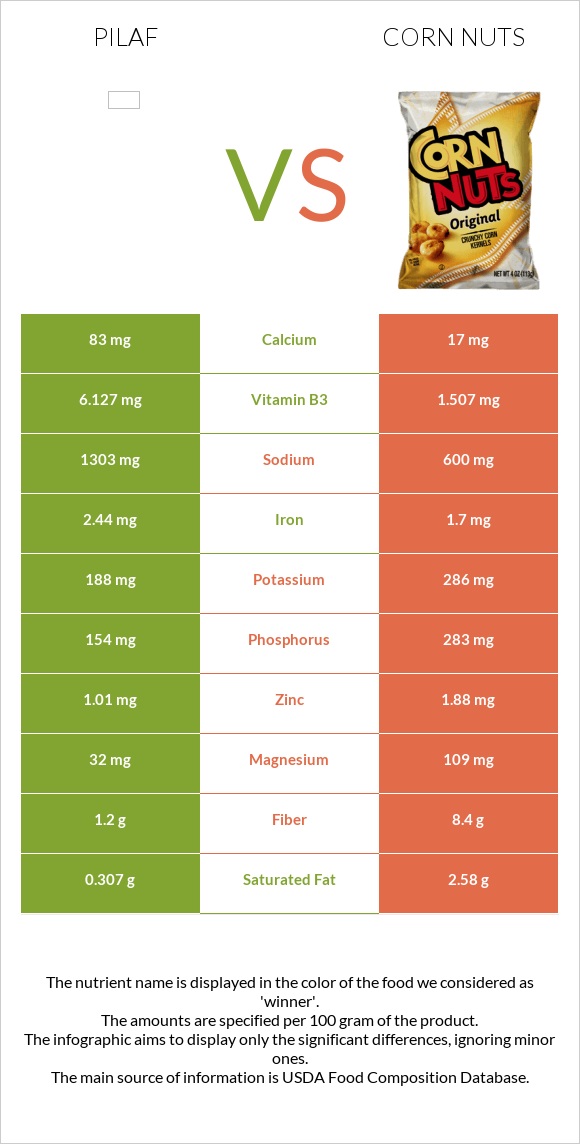
Summary of differences between pilaf and corn nuts Pilaf has more folate, vitamin B3, vitamin B1, manganese, and vitamin B6, while corn nuts have more fiber, phosphorus, and magnesium. Pilaf covers your daily need for folate, 53% more than corn nuts. Pilaf contains 4 times more vitamin B3 than corn nuts. While pilaf contains 6.127mg of vitamin B3, corn nuts contain only 1.507mg. The amount of sodium in corn nuts is lower. Corn nuts have a lower glycemic index. The glycemic index of corn nuts is 40, while the glycemic index of pilaf is 60. These are the specific foods used in this comparison Rice and vermicelli mix, rice pilaf flavor, unprepared and Snacks, cornnuts, barbecue-flavor .
Infographic
Mineral Comparison
Mineral comparison score is based on the number of minerals by which one or the other food is richer. The "coverage" charts below show how much of the daily needs can be covered by 300 grams of the food.
5
100 g
300 g
1 tbsp - 9.6g 0.333 cup - 68g
Magnesium
Magnesium
Calcium
Calcium
Potassium
Potassium
Iron
Iron
Copper
Copper
Zinc
Zinc
Phosphorus
Phosphorus
Sodium
Sodium
Manganese
Manganese
Selenium
Selenium
23%
25%
17%
92%
55%
28%
66%
170%
115%
177%
5
100 g
300 g
1 oz - 28.35g 2 oz - 57g
Magnesium
Magnesium
Calcium
Calcium
Potassium
Potassium
Iron
Iron
Copper
Copper
Zinc
Zinc
Phosphorus
Phosphorus
Sodium
Sodium
Manganese
Manganese
Selenium
Selenium
78%
5.1%
25%
64%
45%
51%
121%
78%
64%
0%
Vitamin Comparison
Vitamin comparison score is based on the number of vitamins by which one or the other food is richer. The "coverage" charts below show how much of the daily needs can be covered by 300 grams of the food.
9
100 g
300 g
1 tbsp - 9.6g 0.333 cup - 68g
Vitamin C
Vit. C
Vitamin D
Vit. D
Vitamin A
Vit. A
Vitamin E
Vit. E
Vitamin B1
Vit. B1
Vitamin B2
Vit. B2
Vitamin B3
Vit. B3
Vitamin B5
Vit. B5
Vitamin B6
Vit. B6
Vitamin B12
Vit. B12
Vitamin K
Vit. K
Folate
Folate
14%
0%
1.3%
0.8%
151%
20%
115%
43%
92%
2.5%
1.3%
159%
2
100 g
300 g
1 oz - 28.35g 2 oz - 57g
Vitamin C
Vit. C
Vitamin D
Vit. D
Vitamin A
Vit. A
Vitamin E
Vit. E
Vitamin B1
Vit. B1
Vitamin B2
Vit. B2
Vitamin B3
Vit. B3
Vitamin B5
Vit. B5
Vitamin B6
Vit. B6
Vitamin B12
Vit. B12
Vitamin K
Vit. K
Folate
Folate
1.3%
0%
5.7%
0%
88%
33%
28%
22%
43%
0%
0%
0%
All nutrients comparison - raw data values
Nutrient
DV% diff.
Selenium
32.4µg
59%
Folate
212µg
0µg
53%
Sodium
1303mg
600mg
31%
Fiber
1.2g
8.4g
29%
Starch
71.23g
29%
Vitamin B3
6.127mg
1.507mg
29%
Vitamin B1
0.603mg
0.35mg
21%
Fats
1.37g
14.3g
20%
Polyunsaturated fat
0.377g
3.22g
19%
Magnesium
32mg
109mg
18%
Phosphorus
154mg
283mg
18%
Manganese
0.882mg
0.487mg
17%
Monounsaturated fat
0.373g
7.36g
17%
Vitamin B6
0.4mg
0.187mg
16%
Saturated fat
0.307g
2.58g
10%
Iron
2.44mg
1.7mg
9%
Zinc
1.01mg
1.88mg
8%
Calcium
83mg
17mg
7%
Vitamin B5
0.715mg
0.374mg
7%
Calories
359kcal
436kcal
4%
Vitamin C
4.1mg
0.4mg
4%
Vitamin B2
0.087mg
0.142mg
4%
Protein
10.42g
9g
3%
Potassium
188mg
286mg
3%
Copper
0.166mg
0.136mg
3%
Choline
17.5mg
3%
Carbs
76.31g
71.7g
2%
Vitamin A
4µg
17µg
1%
Vitamin B12
0.02µg
0µg
1%
Protein per 100 calories
2.9g
2.1g
N/A
Calories per 10 g protein
345kcal
484kcal
N/A
Weight per 100 calories
28g
23g
N/A
Unsaturated / Saturated Fat ratio
2.4
4.1
N/A
Net carbs
75.11g
63.3g
N/A
Cholesterol
1mg
0mg
0%
Sugar
1.53g
N/A
Vitamin E
0.04mg
0%
Vitamin K
0.5µg
0%
Tryptophan
0.086mg
0%
Threonine
0.221mg
0%
Isoleucine
0.279mg
0%
Leucine
0.523mg
0%
Lysine
0.189mg
0%
Methionine
0.145mg
0%
Phenylalanine
0.32mg
0%
Valine
0.374mg
0%
Histidine
0.15mg
0%
Macronutrient Comparison
Macronutrient breakdown side-by-side comparison
4
10%
76%
8%
4%
Protein:
10.42 g
Fats:
1.37 g
Carbs:
76.31 g
Water:
8.04 g
Other:
3.86 g
1
9%
14%
72%
3%
Protein:
9 g
Fats:
14.3 g
Carbs:
71.7 g
Water:
1.6 g
Other:
3.4 g
Contains
more
Protein Protein
+15.8%
Contains
more
Water Water
+402.5%
Contains
more
Other Other
+13.5%
Contains
more
Fats Fats
+943.8%
Fat Type Comparison
Fat type breakdown side-by-side comparison
1
29%
35%
36%
Saturated fat:
Sat. Fat
0.307 g
Monounsaturated fat:
Mono. Fat
0.373 g
Polyunsaturated fat:
Poly. Fat
0.377 g
2
20%
56%
24%
Saturated fat:
Sat. Fat
2.58 g
Monounsaturated fat:
Mono. Fat
7.36 g
Polyunsaturated fat:
Poly. Fat
3.22 g
Contains
less
Sat. Fat Saturated fat
-88.1%
Contains
more
Mono. Fat Monounsaturated fat
+1873.2%
Contains
more
Poly. Fat Polyunsaturated fat
+754.1%