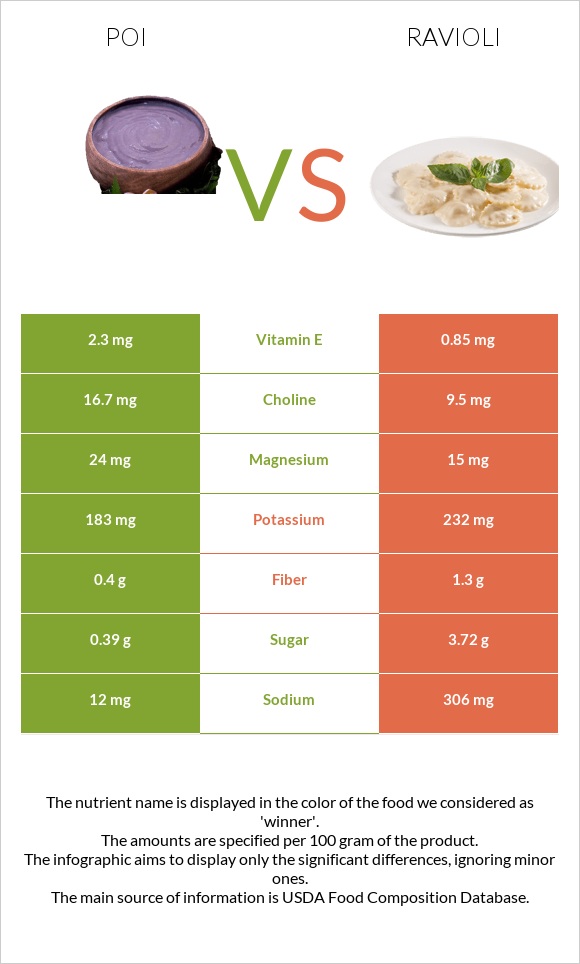
How are poi and ravioli different? Poi has more vitamin B6, vitamin E, and manganese; however, ravioli is richer in selenium. Poi covers your daily need for vitamin B6, 13% more than ravioli. Poi has 3 times more vitamin E than ravioli. Poi has 2.3mg of vitamin E, while ravioli has 0.85mg. Poi contains less sugar. Poi and Ravioli, cheese-filled, canned types were used in this article.
Infographic
Mineral Comparison
Mineral comparison score is based on the number of minerals by which one or the other food is richer. The "coverage" charts below show how much of the daily needs can be covered by 300 grams of the food.
5
100 g
300 g
1 cup - 240g
Magnesium
Magnesium
Calcium
Calcium
Potassium
Potassium
Iron
Iron
Copper
Copper
Zinc
Zinc
Phosphorus
Phosphorus
Sodium
Sodium
Manganese
Manganese
Selenium
Selenium
17%
4.8%
16%
33%
55%
6%
17%
1.6%
48%
3.8%
5
100 g
300 g
1 cup - 242g
Magnesium
Magnesium
Calcium
Calcium
Potassium
Potassium
Iron
Iron
Copper
Copper
Zinc
Zinc
Phosphorus
Phosphorus
Sodium
Sodium
Manganese
Manganese
Selenium
Selenium
11%
9.9%
20%
28%
47%
9.8%
21%
40%
23%
19%
Vitamin Comparison
Vitamin comparison score is based on the number of vitamins by which one or the other food is richer. The "coverage" charts below show how much of the daily needs can be covered by 300 grams of the food.
4
100 g
300 g
1 cup - 240g
Vitamin C
Vit. C
Vitamin D
Vit. D
Vitamin A
Vit. A
Vitamin E
Vit. E
Vitamin B1
Vit. B1
Vitamin B2
Vit. B2
Vitamin B3
Vit. B3
Vitamin B5
Vit. B5
Vitamin B6
Vit. B6
Vitamin B12
Vit. B12
Vitamin K
Vit. K
Folate
Folate
13%
0%
1%
46%
33%
9.2%
21%
18%
63%
0%
2.5%
16%
4
100 g
300 g
1 cup - 242g
Vitamin C
Vit. C
Vitamin D
Vit. D
Vitamin A
Vit. A
Vitamin E
Vit. E
Vitamin B1
Vit. B1
Vitamin B2
Vit. B2
Vitamin B3
Vit. B3
Vitamin B5
Vit. B5
Vitamin B6
Vit. B6
Vitamin B12
Vit. B12
Vitamin K
Vit. K
Folate
Folate
0%
0%
3.3%
17%
19%
18%
20%
16%
24%
3.8%
5.8%
15%
All nutrients comparison - raw data values
Nutrient
DV% diff.
Sodium
12mg
306mg
13%
Vitamin B6
0.273mg
0.102mg
13%
Vitamin E
2.3mg
0.85mg
10%
Manganese
0.37mg
0.176mg
8%
Carbs
27.23g
13.64g
5%
Selenium
0.7µg
3.5µg
5%
Vitamin B1
0.13mg
0.074mg
5%
Protein
0.38g
2.48g
4%
Vitamin C
4mg
0mg
4%
Fiber
0.4g
1.3g
4%
Copper
0.166mg
0.142mg
3%
Vitamin B2
0.04mg
0.08mg
3%
Saturated fat
0.029g
0.723g
3%
Calories
112kcal
77kcal
2%
Fats
0.14g
1.45g
2%
Magnesium
24mg
15mg
2%
Calcium
16mg
33mg
2%
Iron
0.88mg
0.74mg
2%
Phosphorus
39mg
50mg
2%
Cholesterol
0mg
3mg
1%
Potassium
183mg
232mg
1%
Zinc
0.22mg
0.36mg
1%
Vitamin A
3µg
10µg
1%
Vitamin B12
0µg
0.03µg
1%
Vitamin K
1µg
2.3µg
1%
Choline
16.7mg
9.5mg
1%
Monounsaturated fat
0.011g
0.418g
1%
Polyunsaturated fat
0.058g
0.182g
1%
Protein per 100 calories
0.34g
3.2g
N/A
Calories per 10 g protein
2947kcal
310kcal
N/A
Weight per 100 calories
89g
130g
N/A
Net carbs
26.83g
12.34g
N/A
Sugar
0.39g
3.72g
N/A
Vitamin B3
1.1mg
1.06mg
0%
Vitamin B5
0.293mg
0.272mg
0%
Folate
21µg
20µg
0%
Macronutrient Comparison
Macronutrient breakdown side-by-side comparison
1
27%
72%
Protein:
0.38 g
Fats:
0.14 g
Carbs:
27.23 g
Water:
71.64 g
Other:
0.61 g
4
2%
14%
81%
Protein:
2.48 g
Fats:
1.45 g
Carbs:
13.64 g
Water:
80.91 g
Other:
1.52 g
Contains
more
Carbs Carbs
+99.6%
Contains
more
Protein Protein
+552.6%
Contains
more
Fats Fats
+935.7%
Contains
more
Water Water
+12.9%
Contains
more
Other Other
+149.2%
Fat Type Comparison
Fat type breakdown side-by-side comparison
1
30%
11%
59%
Saturated fat:
Sat. Fat
0.029 g
Monounsaturated fat:
Mono. Fat
0.011 g
Polyunsaturated fat:
Poly. Fat
0.058 g
2
55%
32%
14%
Saturated fat:
Sat. Fat
0.723 g
Monounsaturated fat:
Mono. Fat
0.418 g
Polyunsaturated fat:
Poly. Fat
0.182 g
Contains
less
Sat. Fat Saturated fat
-96%
Contains
more
Mono. Fat Monounsaturated fat
+3700%
Contains
more
Poly. Fat Polyunsaturated fat
+213.8%