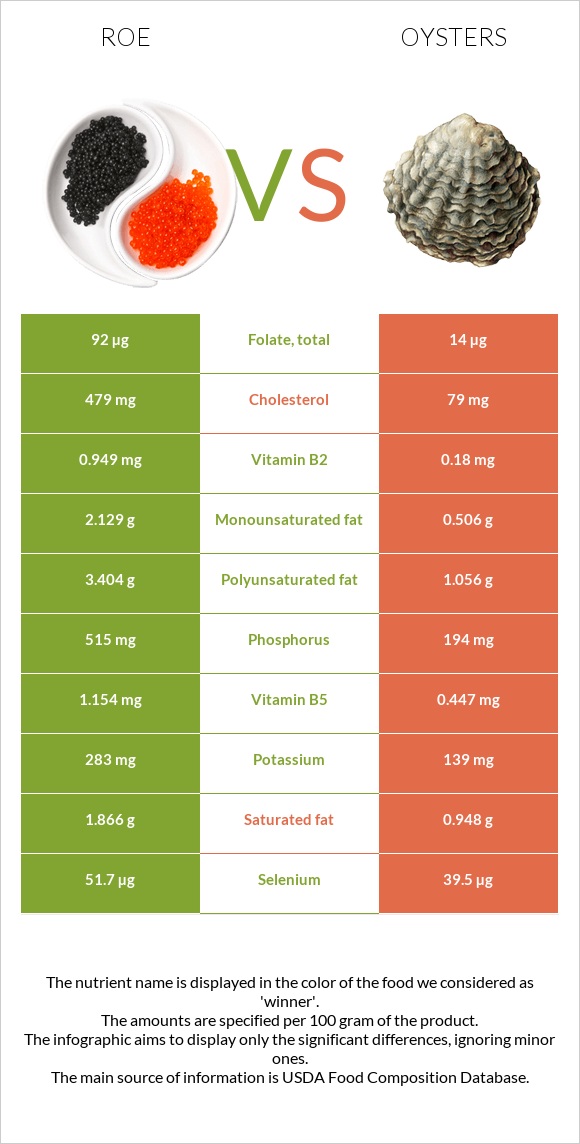
What are the main differences between roe and oysters? Roe is richer in vitamin B2, phosphorus, selenium, and vitamin B1, while oysters is higher in zinc, copper, vitamin B12, iron, and manganese. Oysters's daily need coverage for zinc is 703% higher. Oysters has 8 times less vitamin B1 than roe. Roe has 0.277mg of vitamin B1, while oysters has 0.036mg. Oysters is lower in cholesterol. Roe has a higher glycemic index (27) than oysters (0). We used Fish, roe, mixed species, cooked, dry heat and Mollusks, oyster, eastern, wild, cooked, moist heat types in this comparison.
Infographic
Mineral Comparison
Mineral comparison score is based on the number of minerals by which one or the other food is richer. The "coverage" charts below show how much of the daily needs can be covered by 300 grams of the food.
4
100 g
300 g
1 oz - 28.35g 3 oz - 85g
Magnesium
Magnesium
Calcium
Calcium
Potassium
Potassium
Iron
Iron
Copper
Copper
Zinc
Zinc
Phosphorus
Phosphorus
Sodium
Sodium
Manganese
Manganese
Selenium
Selenium
19%
8.4%
25%
29%
43%
35%
221%
15%
1.7%
282%
6
100 g
300 g
6 medium - 42g 3 oz - 85g
Magnesium
Magnesium
Calcium
Calcium
Potassium
Potassium
Iron
Iron
Copper
Copper
Zinc
Zinc
Phosphorus
Phosphorus
Sodium
Sodium
Manganese
Manganese
Selenium
Selenium
25%
35%
12%
345%
1902%
2144%
83%
22%
77%
215%
Vitamin Comparison
Vitamin comparison score is based on the number of vitamins by which one or the other food is richer. The "coverage" charts below show how much of the daily needs can be covered by 300 grams of the food.
8
100 g
300 g
1 oz - 28.35g 3 oz - 85g
Vitamin C
Vit. C
Vitamin D
Vit. D
Vitamin A
Vit. A
Vitamin E
Vit. E
Vitamin B1
Vit. B1
Vitamin B2
Vit. B2
Vitamin B3
Vit. B3
Vitamin B5
Vit. B5
Vitamin B6
Vit. B6
Vitamin B12
Vit. B12
Vitamin K
Vit. K
Folate
Folate
55%
0%
30%
0%
69%
219%
41%
69%
43%
1443%
0%
69%
3
100 g
300 g
6 medium - 42g 3 oz - 85g
Vitamin C
Vit. C
Vitamin D
Vit. D
Vitamin A
Vit. A
Vitamin E
Vit. E
Vitamin B1
Vit. B1
Vitamin B2
Vit. B2
Vitamin B3
Vit. B3
Vitamin B5
Vit. B5
Vitamin B6
Vit. B6
Vitamin B12
Vit. B12
Vitamin K
Vit. K
Folate
Folate
0%
0%
8.7%
34%
9%
42%
35%
27%
14%
2188%
5%
11%
All nutrients comparison - raw data values
Nutrient
DV% diff.
Zinc
1.28mg
78.6mg
703%
Copper
0.128mg
5.707mg
620%
Vitamin B12
11.54µg
17.5µg
248%
Cholesterol
479mg
79mg
133%
Iron
0.77mg
9.21mg
106%
Vitamin B2
0.949mg
0.18mg
59%
Phosphorus
515mg
194mg
46%
Protein
28.62g
11.42g
34%
Manganese
0.013mg
0.591mg
25%
Choline
130mg
24%
Selenium
51.7µg
39.5µg
22%
Vitamin B1
0.277mg
0.036mg
20%
Folate
92µg
14µg
20%
Vitamin C
16.4mg
0mg
18%
Polyunsaturated fat
3.404g
1.056g
16%
Vitamin B5
1.154mg
0.447mg
14%
Vitamin E
1.7mg
11%
Vitamin B6
0.185mg
0.061mg
10%
Calcium
28mg
116mg
9%
Fats
8.23g
3.42g
7%
Vitamin A
91µg
26µg
7%
Calories
204kcal
102kcal
5%
Potassium
283mg
139mg
4%
Saturated fat
1.866g
0.948g
4%
Monounsaturated fat
2.129g
0.506g
4%
Magnesium
26mg
35mg
2%
Sodium
117mg
166mg
2%
Vitamin B3
2.192mg
1.85mg
2%
Vitamin K
2µg
2%
Carbs
1.92g
5.45g
1%
Protein per 100 calories
14g
11g
N/A
Calories per 10 g protein
71kcal
89kcal
N/A
Weight per 100 calories
49g
98g
N/A
Unsaturated / Saturated Fat ratio
3
1.6
N/A
Net carbs
1.92g
5.45g
N/A
Vitamin D*
2 IU
0%
Sugar
1.23g
N/A
Starch
0.9g
0%
Trans fat
0.068g
N/A
Tryptophan
0.375mg
0.138mg
0%
Threonine
1.305mg
0.046mg
0%
Isoleucine
1.465mg
0.459mg
0%
Leucine
2.509mg
0.716mg
0%
Lysine
2.179mg
0.762mg
0%
Methionine
0.71mg
0.257mg
0%
Phenylalanine
1.401mg
0.413mg
0%
Valine
1.676mg
0.523mg
0%
Histidine
0.778mg
0.22mg
0%
Omega-3 - EPA
1.26g
0.353g
N/A
Omega-3 - DHA
1.747g
0.271g
N/A
Omega-3 - ALA
0.163g
N/A
Omega-3 - DPA
0.105g
0.02g
N/A
Omega-3 - Eicosatrienoic acid
0.004g
N/A
Omega-6 - Gamma-linoleic acid
0.004g
N/A
Omega-6 - Dihomo-gamma-linoleic acid
0.007g
N/A
Omega-6 - Eicosadienoic acid
0.007g
N/A
Omega-6 - Linoleic acid
0.061g
N/A
Macronutrient Comparison
Macronutrient breakdown side-by-side comparison
3
29%
8%
2%
59%
3%
Protein:
28.62 g
Fats:
8.23 g
Carbs:
1.92 g
Water:
58.63 g
Other:
2.6 g
2
11%
3%
5%
78%
Protein:
11.42 g
Fats:
3.42 g
Carbs:
5.45 g
Water:
78.19 g
Other:
1.52 g
Contains
more
Protein Protein
+150.6%
Contains
more
Fats Fats
+140.6%
Contains
more
Other Other
+71.1%
Contains
more
Carbs Carbs
+183.9%
Contains
more
Water Water
+33.4%
Fat Type Comparison
Fat type breakdown side-by-side comparison
2
25%
29%
46%
Saturated fat:
Sat. Fat
1.866 g
Monounsaturated fat:
Mono. Fat
2.129 g
Polyunsaturated fat:
Poly. Fat
3.404 g
1
38%
20%
42%
Saturated fat:
Sat. Fat
0.948 g
Monounsaturated fat:
Mono. Fat
0.506 g
Polyunsaturated fat:
Poly. Fat
1.056 g
Contains
more
Mono. Fat Monounsaturated fat
+320.8%
Contains
more
Poly. Fat Polyunsaturated fat
+222.3%
Contains
less
Sat. Fat Saturated fat
-49.2%