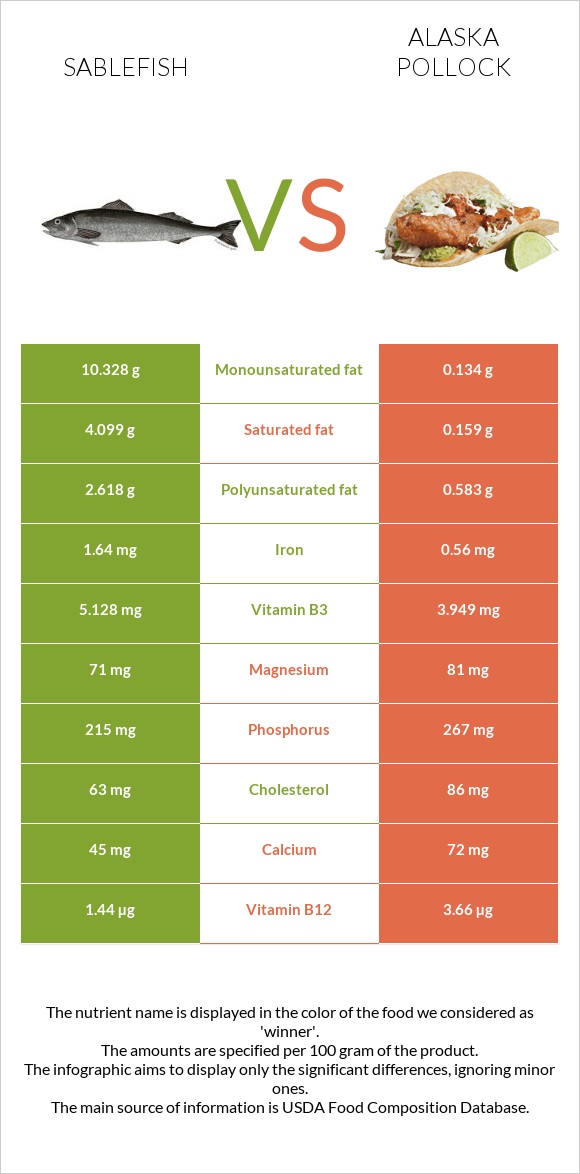
A recap on the differences between sablefish and pollock Sablefish is higher in iron, vitamin B5, vitamin B3, and vitamin A, yet pollock is higher in vitamin B12, vitamin B2, and phosphorus. Pollock covers your daily vitamin B12 needs 93% more than sablefish. Sablefish contains 26 times more saturated fat than pollock. While sablefish contains 4.099g of saturated fat, pollock contains only 0.159g. Food varieties used in this article are Fish, sablefish, cooked, dry heat and Fish, pollock, Alaska, cooked, dry heat (may have been previously frozen) .
Infographic
Mineral Comparison
Mineral comparison score is based on the number of minerals by which one or the other food is richer. The "coverage" charts below show how much of the daily needs can be covered by 300 grams of the food.
2
100 g
300 g
3 oz - 85g 0.5 fillet - 151g
Magnesium
Magnesium
Calcium
Calcium
Potassium
Potassium
Iron
Iron
Copper
Copper
Zinc
Zinc
Phosphorus
Phosphorus
Sodium
Sodium
Manganese
Manganese
Selenium
Selenium
51%
14%
41%
62%
9.3%
11%
92%
9.4%
2.5%
255%
5
100 g
300 g
1 fillet - 60g 3 oz - 85g
Magnesium
Magnesium
Calcium
Calcium
Potassium
Potassium
Iron
Iron
Copper
Copper
Zinc
Zinc
Phosphorus
Phosphorus
Sodium
Sodium
Manganese
Manganese
Selenium
Selenium
58%
22%
38%
21%
20%
16%
114%
55%
2.3%
241%
Vitamin Comparison
Vitamin comparison score is based on the number of vitamins by which one or the other food is richer. The "coverage" charts below show how much of the daily needs can be covered by 300 grams of the food.
5
100 g
300 g
3 oz - 85g 0.5 fillet - 151g
Vitamin C
Vit. C
Vitamin D
Vit. D
Vitamin A
Vit. A
Vitamin E
Vit. E
Vitamin B1
Vit. B1
Vitamin B2
Vit. B2
Vitamin B3
Vit. B3
Vitamin B5
Vit. B5
Vitamin B6
Vit. B6
Vitamin B12
Vit. B12
Vitamin K
Vit. K
Folate
Folate
0%
0%
34%
0%
31%
27%
96%
52%
80%
180%
0%
13%
5
100 g
300 g
1 fillet - 60g 3 oz - 85g
Vitamin C
Vit. C
Vitamin D
Vit. D
Vitamin A
Vit. A
Vitamin E
Vit. E
Vitamin B1
Vit. B1
Vitamin B2
Vit. B2
Vitamin B3
Vit. B3
Vitamin B5
Vit. B5
Vitamin B6
Vit. B6
Vitamin B12
Vit. B12
Vitamin K
Vit. K
Folate
Folate
0%
20%
5.7%
5.6%
14%
51%
74%
26%
76%
458%
0.25%
2.3%
All nutrients comparison - raw data values
Nutrient
DV% diff.
Vitamin B12
1.44µg
3.66µg
93%
Fats
19.62g
1.18g
28%
Monounsaturated fat
10.328g
0.134g
25%
Saturated fat
4.099g
0.159g
18%
Choline
91.6mg
17%
Sodium
72mg
419mg
15%
Iron
1.64mg
0.56mg
14%
Polyunsaturated fat
2.618g
0.583g
14%
Protein
17.19g
23.48g
13%
Vitamin A
102µg
17µg
9%
Vitamin B5
0.865mg
0.432mg
9%
Cholesterol
63mg
86mg
8%
Vitamin B2
0.115mg
0.223mg
8%
Calories
250kcal
111kcal
7%
Vitamin D
1.3µg
7%
Phosphorus
215mg
267mg
7%
Vitamin B3
5.128mg
3.949mg
7%
Vitamin D*
51 IU
6%
Vitamin B1
0.122mg
0.054mg
6%
Selenium
46.8µg
44.1µg
5%
Copper
0.028mg
0.06mg
4%
Folate
17µg
3µg
4%
Calcium
45mg
72mg
3%
Magnesium
71mg
81mg
2%
Vitamin E
0.28mg
2%
Potassium
459mg
430mg
1%
Zinc
0.41mg
0.57mg
1%
Vitamin B6
0.346mg
0.329mg
1%
Protein per 100 calories
6.9g
21g
N/A
Calories per 10 g protein
145kcal
47kcal
N/A
Weight per 100 calories
40g
90g
N/A
Unsaturated / Saturated Fat ratio
3.2
4.5
N/A
Manganese
0.019mg
0.018mg
0%
Vitamin K
0.1µg
0%
Tryptophan
0.193mg
0.263mg
0%
Threonine
0.754mg
1.029mg
0%
Isoleucine
0.792mg
1.082mg
0%
Leucine
1.397mg
1.908mg
0%
Lysine
1.579mg
2.157mg
0%
Methionine
0.509mg
0.696mg
0%
Phenylalanine
0.671mg
0.917mg
0%
Valine
0.886mg
1.21mg
0%
Histidine
0.506mg
0.691mg
0%
Omega-3 - EPA
0.867g
0.086g
N/A
Omega-3 - DHA
0.92g
0.423g
N/A
Omega-3 - DPA
0.216g
0.027g
N/A
Macronutrient Comparison
Macronutrient breakdown side-by-side comparison
1
17%
20%
63%
Protein:
17.19 g
Fats:
19.62 g
Carbs:
0 g
Water:
62.85 g
Other:
0.34 g
3
23%
74%
2%
Protein:
23.48 g
Fats:
1.18 g
Carbs:
0 g
Water:
73.65 g
Other:
1.69 g
Contains
more
Fats Fats
+1562.7%
Contains
more
Protein Protein
+36.6%
Contains
more
Water Water
+17.2%
Contains
more
Other Other
+397.1%
Fat Type Comparison
Fat type breakdown side-by-side comparison
2
24%
61%
15%
Saturated fat:
Sat. Fat
4.099 g
Monounsaturated fat:
Mono. Fat
10.328 g
Polyunsaturated fat:
Poly. Fat
2.618 g
1
18%
15%
67%
Saturated fat:
Sat. Fat
0.159 g
Monounsaturated fat:
Mono. Fat
0.134 g
Polyunsaturated fat:
Poly. Fat
0.583 g
Contains
more
Mono. Fat Monounsaturated fat
+7607.5%
Contains
more
Poly. Fat Polyunsaturated fat
+349.1%
Contains
less
Sat. Fat Saturated fat
-96.1%