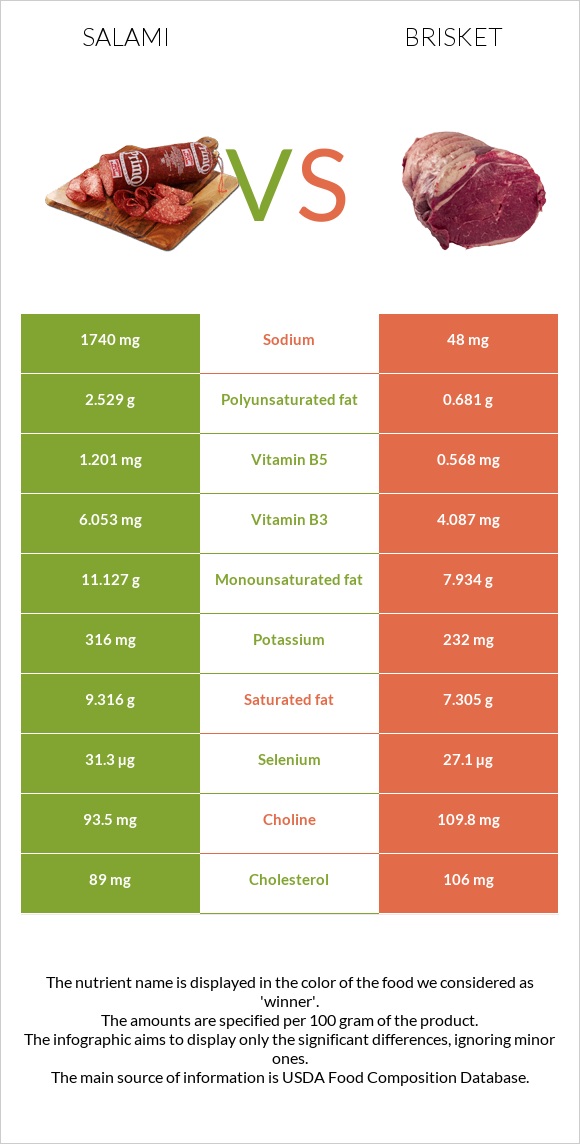
A recap on the differences between salami and brisket Salami is higher in manganese, copper, vitamin B1, vitamin B2, vitamin B6, vitamin B5, and vitamin B3, yet brisket is higher in zinc and vitamin B12. Salami covers your daily sodium needs 74% more than brisket. Salami contains 98 times more manganese than brisket. While salami contains 0.978mg of manganese, brisket contains only 0.01mg. The amount of sodium in brisket is lower. The glycemic index of brisket is lower. Food varieties used in this article are Salami, cooked, beef, and pork and Beef, brisket, flat half, separable lean, and fat, trimmed to 1/8" fat, all grades, cooked, braised .
Infographic
Mineral Comparison
Mineral comparison score is based on the number of minerals by which one or the other food is richer. The "coverage" charts below show how much of the daily needs can be covered by 300 grams of the food.
4
100 g
300 g
1 slice round - 12.3g
Magnesium
Magnesium
Calcium
Calcium
Potassium
Potassium
Iron
Iron
Copper
Copper
Zinc
Zinc
Phosphorus
Phosphorus
Sodium
Sodium
Manganese
Manganese
Selenium
Selenium
14%
4.5%
28%
59%
119%
80%
82%
227%
128%
171%
3
100 g
300 g
3 oz - 85g 1 steak (yield from raw steak weighing 550 g) - 380g
Magnesium
Magnesium
Calcium
Calcium
Potassium
Potassium
Iron
Iron
Copper
Copper
Zinc
Zinc
Phosphorus
Phosphorus
Sodium
Sodium
Manganese
Manganese
Selenium
Selenium
14%
4.8%
20%
91%
33%
182%
75%
6.3%
1.3%
148%
Vitamin Comparison
Vitamin comparison score is based on the number of vitamins by which one or the other food is richer. The "coverage" charts below show how much of the daily needs can be covered by 300 grams of the food.
7
100 g
300 g
1 slice round - 12.3g
Vitamin C
Vit. C
Vitamin D
Vit. D
Vitamin A
Vit. A
Vitamin E
Vit. E
Vitamin B1
Vit. B1
Vitamin B2
Vit. B2
Vitamin B3
Vit. B3
Vitamin B5
Vit. B5
Vitamin B6
Vit. B6
Vitamin B12
Vit. B12
Vitamin K
Vit. K
Folate
Folate
0%
15%
0%
4.4%
92%
82%
113%
72%
106%
190%
8%
2.3%
3
100 g
300 g
3 oz - 85g 1 steak (yield from raw steak weighing 550 g) - 380g
Vitamin C
Vit. C
Vitamin D
Vit. D
Vitamin A
Vit. A
Vitamin E
Vit. E
Vitamin B1
Vit. B1
Vitamin B2
Vit. B2
Vitamin B3
Vit. B3
Vitamin B5
Vit. B5
Vitamin B6
Vit. B6
Vitamin B12
Vit. B12
Vitamin K
Vit. K
Folate
Folate
0%
0%
0%
10%
15%
39%
77%
34%
65%
265%
4.5%
6.8%
All nutrients comparison - raw data values
Nutrient
DV% diff.
Sodium
1740mg
48mg
74%
Manganese
0.978mg
0.01mg
42%
Zinc
2.93mg
6.69mg
34%
Copper
0.357mg
0.1mg
29%
Vitamin B1
0.367mg
0.059mg
26%
Vitamin B12
1.52µg
2.12µg
25%
Protein
21.85g
28.82g
14%
Vitamin B2
0.357mg
0.171mg
14%
Vitamin B6
0.459mg
0.282mg
14%
Vitamin B5
1.201mg
0.568mg
13%
Fats
25.9g
18.42g
12%
Vitamin B3
6.053mg
4.087mg
12%
Polyunsaturated fat
2.529g
0.681g
12%
Iron
1.56mg
2.43mg
11%
Saturated fat
9.316g
7.305g
9%
Selenium
31.3µg
27.1µg
8%
Monounsaturated fat
11.127g
7.934g
8%
Cholesterol
89mg
106mg
6%
Vitamin D*
41 IU
5%
Vitamin D
1µg
5%
Choline
93.5mg
109.8mg
3%
Calories
336kcal
289kcal
2%
Potassium
316mg
232mg
2%
Phosphorus
191mg
175mg
2%
Vitamin E
0.22mg
0.51mg
2%
Folate
3µg
9µg
2%
Carbs
2.4g
0g
1%
Vitamin K
3.2µg
1.8µg
1%
Protein per 100 calories
6.5g
10g
N/A
Calories per 10 g protein
154kcal
100kcal
N/A
Weight per 100 calories
30g
35g
N/A
Unsaturated / Saturated Fat ratio
1.5
1.2
N/A
Net carbs
2.4g
0g
N/A
Magnesium
19mg
19mg
0%
Calcium
15mg
16mg
0%
Sugar
0.96g
0g
N/A
Trans fat
0.586g
N/A
Tryptophan
0.114mg
0.181mg
0%
Threonine
0.521mg
1.101mg
0%
Isoleucine
0.675mg
1.253mg
0%
Leucine
0.929mg
2.192mg
0%
Lysine
1.107mg
2.328mg
0%
Methionine
0.301mg
0.717mg
0%
Phenylalanine
0.481mg
1.088mg
0%
Valine
0.668mg
1.367mg
0%
Histidine
0.359mg
0.879mg
0%
Omega-3 - ALA
0.126g
N/A
Omega-6 - Eicosadienoic acid
0.084g
N/A
Omega-6 - Linoleic acid
2.104g
N/A
Macronutrient Comparison
Macronutrient breakdown side-by-side comparison
3
22%
26%
2%
45%
5%
Protein:
21.85 g
Fats:
25.9 g
Carbs:
2.4 g
Water:
45.19 g
Other:
4.66 g
2
29%
18%
52%
Protein:
28.82 g
Fats:
18.42 g
Carbs:
0 g
Water:
52.48 g
Other:
0.28 g
Contains
more
Fats Fats
+40.6%
Contains
more
Carbs Carbs
+∞%
Contains
more
Other Other
+1564.3%
Contains
more
Protein Protein
+31.9%
Contains
more
Water Water
+16.1%
Fat Type Comparison
Fat type breakdown side-by-side comparison
2
41%
48%
11%
Saturated fat:
Sat. Fat
9.316 g
Monounsaturated fat:
Mono. Fat
11.127 g
Polyunsaturated fat:
Poly. Fat
2.529 g
1
46%
50%
4%
Saturated fat:
Sat. Fat
7.305 g
Monounsaturated fat:
Mono. Fat
7.934 g
Polyunsaturated fat:
Poly. Fat
0.681 g
Contains
more
Mono. Fat Monounsaturated fat
+40.2%
Contains
more
Poly. Fat Polyunsaturated fat
+271.4%
Contains
less
Sat. Fat Saturated fat
-21.6%