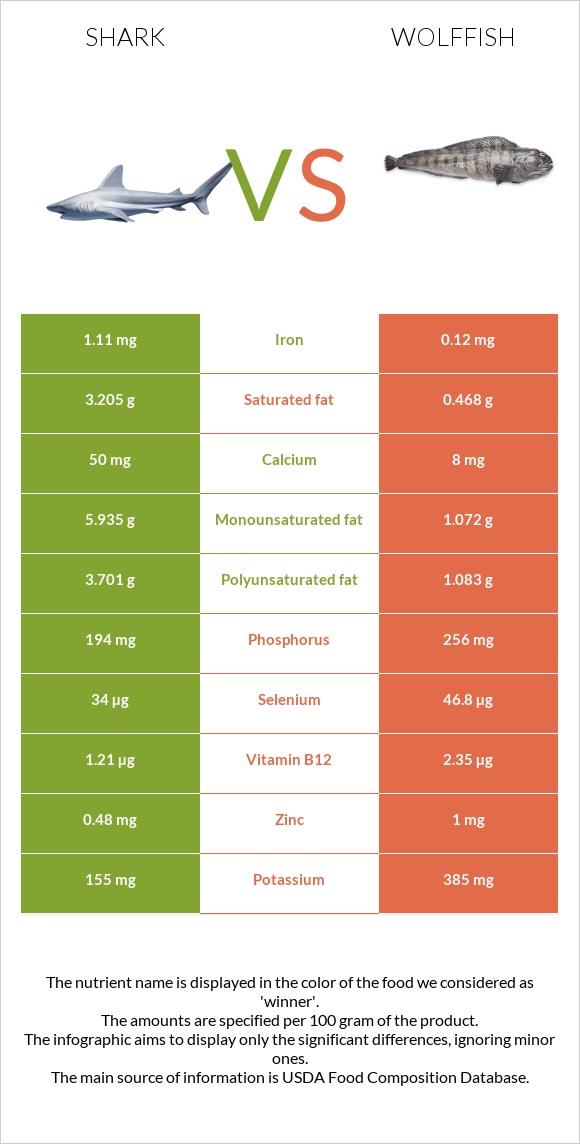
Significant differences between shark and wolffish Shark has more iron; however, wolffish is richer in vitamin B12, selenium, vitamin B6, vitamin B1, phosphorus, potassium, and vitamin A. Wolffish covers your daily vitamin B12 needs 48% more than shark. Wolffish has 9 times less iron than shark. Shark has 1.11mg of iron, while wolffish has 0.12mg. Wolffish contains less saturated fat. Specific food types used in this comparison are Fish, shark, mixed species, cooked, batter-dipped and fried and Fish, wolffish, Atlantic, cooked, dry heat .
Infographic
Mineral Comparison
Mineral comparison score is based on the number of minerals by which one or the other food is richer. The "coverage" charts below show how much of the daily needs can be covered by 300 grams of the food.
5
100 g
300 g
3 oz - 85g
Magnesium
Magnesium
Calcium
Calcium
Potassium
Potassium
Iron
Iron
Copper
Copper
Zinc
Zinc
Phosphorus
Phosphorus
Sodium
Sodium
Manganese
Manganese
Selenium
Selenium
31%
15%
14%
42%
14%
13%
83%
16%
6.5%
185%
5
100 g
300 g
3 oz - 85g 0.5 fillet - 119g
Magnesium
Magnesium
Calcium
Calcium
Potassium
Potassium
Iron
Iron
Copper
Copper
Zinc
Zinc
Phosphorus
Phosphorus
Sodium
Sodium
Manganese
Manganese
Selenium
Selenium
27%
2.4%
34%
4.5%
12%
27%
110%
14%
2.5%
255%
Vitamin Comparison
Vitamin comparison score is based on the number of vitamins by which one or the other food is richer. The "coverage" charts below show how much of the daily needs can be covered by 300 grams of the food.
1
100 g
300 g
3 oz - 85g
Vitamin C
Vit. C
Vitamin D
Vit. D
Vitamin A
Vit. A
Vitamin E
Vit. E
Vitamin B1
Vit. B1
Vitamin B2
Vit. B2
Vitamin B3
Vit. B3
Vitamin B5
Vit. B5
Vitamin B6
Vit. B6
Vitamin B12
Vit. B12
Vitamin K
Vit. K
Folate
Folate
0%
0%
18%
0%
18%
22%
52%
37%
69%
151%
0%
11%
4
100 g
300 g
3 oz - 85g 0.5 fillet - 119g
Vitamin C
Vit. C
Vitamin D
Vit. D
Vitamin A
Vit. A
Vitamin E
Vit. E
Vitamin B1
Vit. B1
Vitamin B2
Vit. B2
Vitamin B3
Vit. B3
Vitamin B5
Vit. B5
Vitamin B6
Vit. B6
Vitamin B12
Vit. B12
Vitamin K
Vit. K
Folate
Folate
0%
0%
43%
0%
52%
22%
49%
39%
107%
294%
0%
4.5%
All nutrients comparison - raw data values
Nutrient
DV% diff.
Vitamin B12
1.21µg
2.35µg
48%
Selenium
34µg
46.8µg
23%
Fats
13.82g
3.06g
17%
Polyunsaturated fat
3.701g
1.083g
17%
Iron
1.11mg
0.12mg
12%
Vitamin B6
0.3mg
0.462mg
12%
Saturated fat
3.205g
0.468g
12%
Monounsaturated fat
5.935g
1.072g
12%
Vitamin B1
0.072mg
0.208mg
11%
Phosphorus
194mg
256mg
9%
Protein
18.62g
22.44g
8%
Vitamin A
54µg
130µg
8%
Potassium
155mg
385mg
7%
Calories
228kcal
123kcal
5%
Zinc
0.48mg
1mg
5%
Calcium
50mg
8mg
4%
Carbs
6.39g
0g
2%
Folate
15µg
6µg
2%
Magnesium
43mg
38mg
1%
Copper
0.042mg
0.037mg
1%
Sodium
122mg
109mg
1%
Manganese
0.05mg
0.019mg
1%
Vitamin B3
2.783mg
2.598mg
1%
Vitamin B5
0.62mg
0.658mg
1%
Protein per 100 calories
8.2g
18g
N/A
Calories per 10 g protein
122kcal
55kcal
N/A
Weight per 100 calories
44g
81g
N/A
Unsaturated / Saturated Fat ratio
3
4.6
N/A
Net carbs
6.39g
0g
N/A
Cholesterol
59mg
59mg
0%
Vitamin B2
0.097mg
0.097mg
0%
Tryptophan
0.212mg
0.251mg
0%
Threonine
0.843mg
0.984mg
0%
Isoleucine
0.867mg
1.034mg
0%
Leucine
1.515mg
1.824mg
0%
Lysine
1.634mg
2.061mg
0%
Methionine
0.541mg
0.664mg
0%
Phenylalanine
0.75mg
0.876mg
0%
Valine
0.965mg
1.156mg
0%
Histidine
0.538mg
0.661mg
0%
Omega-3 - EPA
0.258g
0.393g
N/A
Omega-3 - DHA
0.431g
0.405g
N/A
Omega-3 - DPA
0.089g
0.055g
N/A
Macronutrient Comparison
Macronutrient breakdown side-by-side comparison
3
19%
14%
6%
60%
Protein:
18.62 g
Fats:
13.82 g
Carbs:
6.39 g
Water:
60.09 g
Other:
1.08 g
2
22%
3%
74%
Protein:
22.44 g
Fats:
3.06 g
Carbs:
0 g
Water:
74.23 g
Other:
0.27 g
Contains
more
Fats Fats
+351.6%
Contains
more
Carbs Carbs
+∞%
Contains
more
Other Other
+300%
Contains
more
Protein Protein
+20.5%
Contains
more
Water Water
+23.5%
Fat Type Comparison
Fat type breakdown side-by-side comparison
2
25%
46%
29%
Saturated fat:
Sat. Fat
3.205 g
Monounsaturated fat:
Mono. Fat
5.935 g
Polyunsaturated fat:
Poly. Fat
3.701 g
1
18%
41%
41%
Saturated fat:
Sat. Fat
0.468 g
Monounsaturated fat:
Mono. Fat
1.072 g
Polyunsaturated fat:
Poly. Fat
1.083 g
Contains
more
Mono. Fat Monounsaturated fat
+453.6%
Contains
more
Poly. Fat Polyunsaturated fat
+241.7%
Contains
less
Sat. Fat Saturated fat
-85.4%