Steak vs. Rib eye steak — In-Depth Nutrition Comparison
Compare
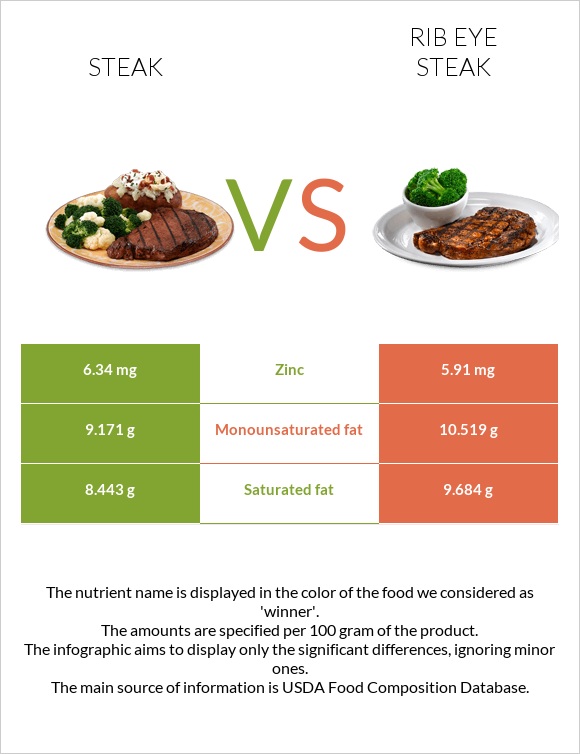
The main differences between steak and rib eye steak
- Rib eye steak is richer than steak in monounsaturated fat.
- Steak contains less saturated fat.
Food types used in this article are Beef, rib eye steak, boneless, lip off, separable lean, and fat, trimmed to 0" fat, all grades, cooked, grilled and Beef, rib eye steak, boneless, lip-on, separable lean, and fat, trimmed to 1/8" fat, all grades, cooked, grilled.
Infographic
Infographic link
Mineral Comparison
Mineral comparison score is based on the number of minerals by which one or the other food is richer. The "coverage" charts below show how much of the daily needs can be covered by 300 grams of the food.
Vitamin Comparison
Vitamin comparison score is based on the number of vitamins by which one or the other food is richer. The "coverage" charts below show how much of the daily needs can be covered by 300 grams of the food.
| Contains more Vitamin AVitamin A | +14.3% |
| Contains more Vitamin DVitamin D | +100% |
All nutrients comparison - raw data values
| Nutrient |  |
 |
DV% diff. |
| Vitamin B5 | 0.536mg | 11% | |
| Choline | 48.8mg | 9% | |
| Saturated fat | 8.443g | 9.684g | 6% |
| Fats | 19.02g | 21.81g | 4% |
| Zinc | 6.34mg | 5.91mg | 4% |
| Selenium | 31.8µg | 29.7µg | 4% |
| Vitamin B12 | 2.2µg | 2.1µg | 4% |
| Manganese | 0.08mg | 3% | |
| Monounsaturated fat | 9.171g | 10.519g | 3% |
| Protein | 24.85g | 23.69g | 2% |
| Iron | 2.4mg | 2.24mg | 2% |
| Phosphorus | 163mg | 152mg | 2% |
| Vitamin B3 | 5.149mg | 4.908mg | 2% |
| Vitamin B6 | 0.5mg | 0.477mg | 2% |
| Calories | 271kcal | 291kcal | 1% |
| Cholesterol | 78mg | 80mg | 1% |
| Potassium | 279mg | 260mg | 1% |
| Copper | 0.085mg | 0.08mg | 1% |
| Vitamin E | 0.1mg | 1% | |
| Vitamin D | 0.1µg | 0.2µg | 1% |
| Vitamin B2 | 0.301mg | 0.287mg | 1% |
| Polyunsaturated fat | 0.896g | 1.027g | 1% |
| Vitamin D | 6 IU | 7 IU | 0% |
| Magnesium | 23mg | 22mg | 0% |
| Calcium | 12mg | 11mg | 0% |
| Sodium | 58mg | 54mg | 0% |
| Vitamin A | 7µg | 8µg | 0% |
| Vitamin B1 | 0.074mg | 0.071mg | 0% |
| Vitamin K | 1.6µg | 1.6µg | 0% |
| Folate | 6µg | 6µg | 0% |
| Trans fat | 1.478g | N/A | |
| Tryptophan | 0.278mg | 0.265mg | 0% |
| Threonine | 1.171mg | 1.116mg | 0% |
| Isoleucine | 1.157mg | 1.103mg | 0% |
| Leucine | 2.142mg | 2.041mg | 0% |
| Lysine | 2.38mg | 2.269mg | 0% |
| Methionine | 0.672mg | 0.641mg | 0% |
| Phenylalanine | 0.997mg | 0.95mg | 0% |
| Valine | 1.242mg | 1.184mg | 0% |
| Histidine | 0.931mg | 0.888mg | 0% |
| Omega-3 - EPA | 0.001g | 0.001g | N/A |
| Omega-3 - DHA | 0.001g | 0.001g | N/A |
| Omega-3 - ALA | 0.038g | N/A | |
| Omega-3 - DPA | 0.013g | 0.014g | N/A |
| Omega-6 - Dihomo-gamma-linoleic acid | 0.024g | N/A | |
| Omega-6 - Eicosadienoic acid | 0.005g | N/A | |
| Omega-6 - Linoleic acid | 0.7g | N/A |
Macronutrient Comparison
Macronutrient breakdown side-by-side comparison
Protein:
24.85 g
Fats:
19.02 g
Carbs:
0 g
Water:
55.59 g
Other:
0.54 g
Protein:
23.69 g
Fats:
21.81 g
Carbs:
0 g
Water:
54.49 g
Other:
0.01 g
| Contains more OtherOther | +5300% |
| Contains more FatsFats | +14.7% |
~equal in
Protein
~23.69g
~equal in
Carbs
~0g
~equal in
Water
~54.49g
Fat Type Comparison
Fat type breakdown side-by-side comparison
Saturated fat:
Sat. Fat
8.443 g
Monounsaturated fat:
Mono. Fat
9.171 g
Polyunsaturated fat:
Poly. Fat
0.896 g
Saturated fat:
Sat. Fat
9.684 g
Monounsaturated fat:
Mono. Fat
10.519 g
Polyunsaturated fat:
Poly. Fat
1.027 g
| Contains less Sat. FatSaturated fat | -12.8% |
| Contains more Mono. FatMonounsaturated fat | +14.7% |
| Contains more Poly. FatPolyunsaturated fat | +14.6% |


