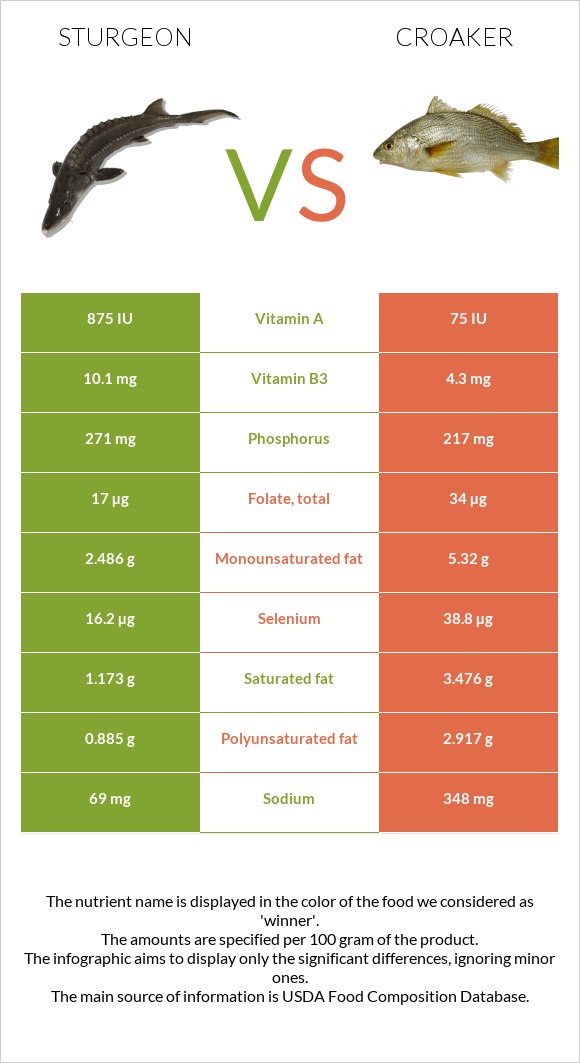
What are the main differences between sturgeon and croaker? Sturgeon is richer in vitamin B3, vitamin B12, vitamin A, and phosphorus, yet croaker is richer in selenium, monounsaturated fat, and polyunsaturated fat. Croaker's daily need coverage for selenium is 41% higher. Sturgeon has 12 times more vitamin A than croaker. Sturgeon has 875 IU of vitamin A, while croaker has 75 IU. Sturgeon contains less saturated fat. We used Fish, sturgeon, mixed species, cooked, dry heat and Fish, croaker, Atlantic, cooked, breaded, and fried types in this comparison.
Infographic
Mineral Comparison
Mineral comparison score is based on the number of minerals by which one or the other food is richer. The "coverage" charts below show how much of the daily needs can be covered by 300 grams of the food.
2
100 g
300 g
1 cubic inch, boneless - 17g 1 oz, boneless - 28.35g 3 oz - 85g 1 cup, cooked - 136g 1 piece (4-1/2" x 2-1/8" x 7/8") - 145g
Magnesium
Magnesium
Calcium
Calcium
Potassium
Potassium
Iron
Iron
Copper
Copper
Zinc
Zinc
Phosphorus
Phosphorus
Sodium
Sodium
Manganese
Manganese
Selenium
Selenium
32%
5.1%
32%
34%
18%
15%
116%
9%
3.9%
88%
4
100 g
300 g
3 oz - 85g 1 fillet - 87g
Magnesium
Magnesium
Calcium
Calcium
Potassium
Potassium
Iron
Iron
Copper
Copper
Zinc
Zinc
Phosphorus
Phosphorus
Sodium
Sodium
Manganese
Manganese
Selenium
Selenium
30%
9.6%
30%
32%
22%
14%
93%
45%
10%
212%
Vitamin Comparison
Vitamin comparison score is based on the number of vitamins by which one or the other food is richer. The "coverage" charts below show how much of the daily needs can be covered by 300 grams of the food.
7
100 g
300 g
1 cubic inch, boneless - 17g 1 oz, boneless - 28.35g 3 oz - 85g 1 cup, cooked - 136g 1 piece (4-1/2" x 2-1/8" x 7/8") - 145g
Vitamin C
Vit. C
Vitamin D
Vit. D
Vitamin A
Vit. A
Vitamin E
Vit. E
Vitamin B1
Vit. B1
Vitamin B2
Vit. B2
Vitamin B3
Vit. B3
Vitamin B5
Vit. B5
Vitamin B6
Vit. B6
Vitamin B12
Vit. B12
Vitamin K
Vit. K
Folate
Folate
0%
194%
88%
13%
20%
21%
189%
52%
53%
313%
0.25%
13%
4
100 g
300 g
3 oz - 85g 1 fillet - 87g
Vitamin C
Vit. C
Vitamin D
Vit. D
Vitamin A
Vit. A
Vitamin E
Vit. E
Vitamin B1
Vit. B1
Vitamin B2
Vit. B2
Vitamin B3
Vit. B3
Vitamin B5
Vit. B5
Vitamin B6
Vit. B6
Vitamin B12
Vit. B12
Vitamin K
Vit. K
Folate
Folate
0%
0%
7.7%
0%
23%
30%
81%
44%
60%
263%
0%
26%
All nutrients comparison - raw data values
Nutrient
DV% diff.
Vitamin D
12.9µg
65%
Vitamin D*
515 IU
64%
Selenium
16.2µg
38.8µg
41%
Vitamin B3
10.1mg
4.3mg
36%
Vitamin A
263µg
23µg
27%
Vitamin B12
2.5µg
2.1µg
17%
Polyunsaturated fat
0.885g
2.917g
14%
Choline
70mg
13%
Fats
5.18g
12.67g
12%
Sodium
69mg
348mg
12%
Saturated fat
1.173g
3.476g
10%
Phosphorus
271mg
217mg
8%
Monounsaturated fat
2.486g
5.32g
7%
Protein
20.7g
18.2g
5%
Calories
135kcal
221kcal
4%
Vitamin E
0.63mg
4%
Folate
17µg
34µg
4%
Carbs
0g
7.54g
3%
Vitamin B2
0.09mg
0.13mg
3%
Vitamin B5
0.87mg
0.74mg
3%
Cholesterol
77mg
84mg
2%
Calcium
17mg
32mg
2%
Fiber
0g
0.4g
2%
Manganese
0.03mg
0.08mg
2%
Vitamin B6
0.23mg
0.26mg
2%
Magnesium
45mg
42mg
1%
Potassium
364mg
340mg
1%
Iron
0.9mg
0.86mg
1%
Copper
0.053mg
0.065mg
1%
Vitamin B1
0.08mg
0.09mg
1%
Protein per 100 calories
15g
8.2g
N/A
Calories per 10 g protein
65kcal
121kcal
N/A
Weight per 100 calories
74g
45g
N/A
Unsaturated / Saturated Fat ratio
2.9
2.4
N/A
Net carbs
0g
7.14g
N/A
Zinc
0.54mg
0.52mg
0%
Vitamin K
0.1µg
0%
Tryptophan
0.232mg
0.208mg
0%
Threonine
0.907mg
0.788mg
0%
Isoleucine
0.954mg
0.847mg
0%
Leucine
1.682mg
1.48mg
0%
Lysine
1.901mg
1.571mg
0%
Methionine
0.613mg
0.525mg
0%
Phenylalanine
0.808mg
0.742mg
0%
Valine
1.066mg
0.947mg
0%
Histidine
0.609mg
0.525mg
0%
Omega-3 - EPA
0.249g
0.113g
N/A
Omega-3 - DHA
0.119g
0.089g
N/A
Omega-3 - DPA
0.058g
0.079g
N/A
Macronutrient Comparison
Macronutrient breakdown side-by-side comparison
3
21%
5%
70%
4%
Protein:
20.7 g
Fats:
5.18 g
Carbs:
0 g
Water:
69.94 g
Other:
4.18 g
2
18%
13%
8%
60%
2%
Protein:
18.2 g
Fats:
12.67 g
Carbs:
7.54 g
Water:
59.76 g
Other:
1.83 g
Contains
more
Protein Protein
+13.7%
Contains
more
Water Water
+17%
Contains
more
Other Other
+128.4%
Contains
more
Fats Fats
+144.6%
Contains
more
Carbs Carbs
+∞%
Fat Type Comparison
Fat type breakdown side-by-side comparison
1
26%
55%
19%
Saturated fat:
Sat. Fat
1.173 g
Monounsaturated fat:
Mono. Fat
2.486 g
Polyunsaturated fat:
Poly. Fat
0.885 g
2
30%
45%
25%
Saturated fat:
Sat. Fat
3.476 g
Monounsaturated fat:
Mono. Fat
5.32 g
Polyunsaturated fat:
Poly. Fat
2.917 g
Contains
less
Sat. Fat Saturated fat
-66.3%
Contains
more
Mono. Fat Monounsaturated fat
+114%
Contains
more
Poly. Fat Polyunsaturated fat
+229.6%