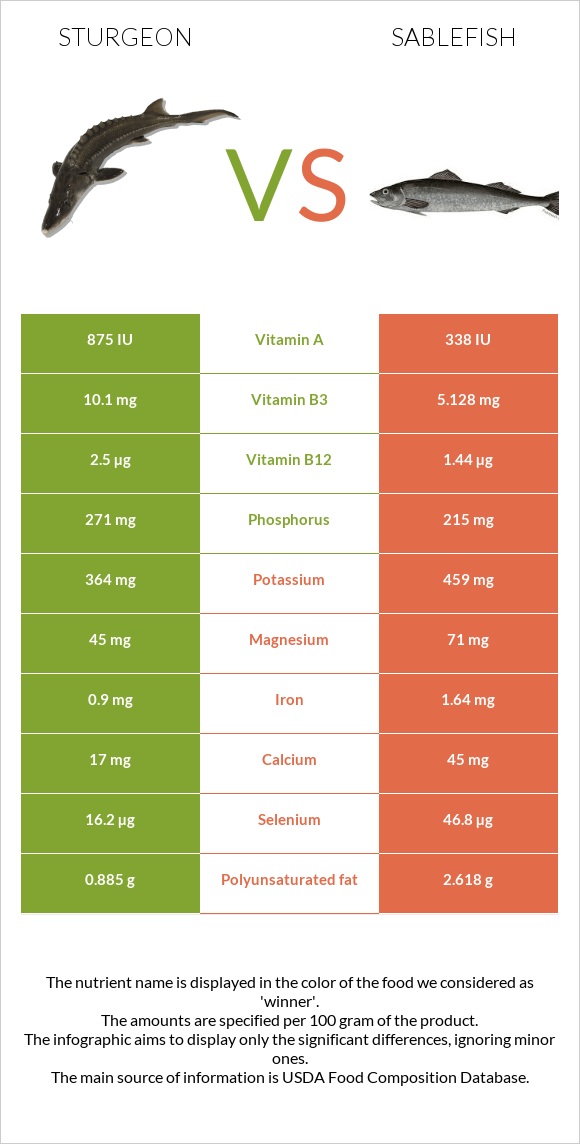
Summary of differences between sturgeon and sablefish Sturgeon has more vitamin B12, vitamin B3, vitamin A, and phosphorus; however, sablefish is higher in selenium, iron, vitamin B6, and magnesium. Sablefish covers your daily need for selenium, 56% more than sturgeon. Sturgeon has 3 times more vitamin A than sablefish. While sturgeon has 875 IU of vitamin A, sablefish has only 338 IU. Sturgeon has less saturated fat. These are the specific foods used in this comparison Fish, sturgeon, mixed species, cooked, dry heat and Fish, sablefish, cooked, dry heat .
Infographic
Mineral Comparison
Mineral comparison score is based on the number of minerals by which one or the other food is richer. The "coverage" charts below show how much of the daily needs can be covered by 300 grams of the food.
4
100 g
300 g
1 cubic inch, boneless - 17g 1 oz, boneless - 28.35g 3 oz - 85g 1 cup, cooked - 136g 1 piece (4-1/2" x 2-1/8" x 7/8") - 145g
Magnesium
Magnesium
Calcium
Calcium
Potassium
Potassium
Iron
Iron
Copper
Copper
Zinc
Zinc
Phosphorus
Phosphorus
Sodium
Sodium
Manganese
Manganese
Selenium
Selenium
32%
5.1%
32%
34%
18%
15%
116%
9%
3.9%
88%
5
100 g
300 g
3 oz - 85g 0.5 fillet - 151g
Magnesium
Magnesium
Calcium
Calcium
Potassium
Potassium
Iron
Iron
Copper
Copper
Zinc
Zinc
Phosphorus
Phosphorus
Sodium
Sodium
Manganese
Manganese
Selenium
Selenium
51%
14%
41%
62%
9.3%
11%
92%
9.4%
2.5%
255%
Vitamin Comparison
Vitamin comparison score is based on the number of vitamins by which one or the other food is richer. The "coverage" charts below show how much of the daily needs can be covered by 300 grams of the food.
6
100 g
300 g
1 cubic inch, boneless - 17g 1 oz, boneless - 28.35g 3 oz - 85g 1 cup, cooked - 136g 1 piece (4-1/2" x 2-1/8" x 7/8") - 145g
Vitamin C
Vit. C
Vitamin D
Vit. D
Vitamin A
Vit. A
Vitamin E
Vit. E
Vitamin B1
Vit. B1
Vitamin B2
Vit. B2
Vitamin B3
Vit. B3
Vitamin B5
Vit. B5
Vitamin B6
Vit. B6
Vitamin B12
Vit. B12
Vitamin K
Vit. K
Folate
Folate
0%
194%
88%
13%
20%
21%
189%
52%
53%
313%
0.25%
13%
3
100 g
300 g
3 oz - 85g 0.5 fillet - 151g
Vitamin C
Vit. C
Vitamin D
Vit. D
Vitamin A
Vit. A
Vitamin E
Vit. E
Vitamin B1
Vit. B1
Vitamin B2
Vit. B2
Vitamin B3
Vit. B3
Vitamin B5
Vit. B5
Vitamin B6
Vit. B6
Vitamin B12
Vit. B12
Vitamin K
Vit. K
Folate
Folate
0%
0%
34%
0%
31%
27%
96%
52%
80%
180%
0%
13%
All nutrients comparison - raw data values
Nutrient
DV% diff.
Vitamin D
12.9µg
65%
Vitamin D*
515 IU
64%
Selenium
16.2µg
46.8µg
56%
Vitamin B12
2.5µg
1.44µg
44%
Vitamin B3
10.1mg
5.128mg
31%
Fats
5.18g
19.62g
22%
Monounsaturated fat
2.486g
10.328g
20%
Vitamin A
263µg
102µg
18%
Choline
70mg
13%
Saturated fat
1.173g
4.099g
13%
Polyunsaturated fat
0.885g
2.618g
12%
Iron
0.9mg
1.64mg
9%
Vitamin B6
0.23mg
0.346mg
9%
Phosphorus
271mg
215mg
8%
Protein
20.7g
17.19g
7%
Calories
135kcal
250kcal
6%
Magnesium
45mg
71mg
6%
Cholesterol
77mg
63mg
5%
Vitamin E
0.63mg
4%
Vitamin B1
0.08mg
0.122mg
4%
Calcium
17mg
45mg
3%
Potassium
364mg
459mg
3%
Copper
0.053mg
0.028mg
3%
Vitamin B2
0.09mg
0.115mg
2%
Zinc
0.54mg
0.41mg
1%
Protein per 100 calories
15g
6.9g
N/A
Calories per 10 g protein
65kcal
145kcal
N/A
Weight per 100 calories
74g
40g
N/A
Unsaturated / Saturated Fat ratio
2.9
3.2
N/A
Sodium
69mg
72mg
0%
Manganese
0.03mg
0.019mg
0%
Vitamin B5
0.87mg
0.865mg
0%
Vitamin K
0.1µg
0%
Folate
17µg
17µg
0%
Tryptophan
0.232mg
0.193mg
0%
Threonine
0.907mg
0.754mg
0%
Isoleucine
0.954mg
0.792mg
0%
Leucine
1.682mg
1.397mg
0%
Lysine
1.901mg
1.579mg
0%
Methionine
0.613mg
0.509mg
0%
Phenylalanine
0.808mg
0.671mg
0%
Valine
1.066mg
0.886mg
0%
Histidine
0.609mg
0.506mg
0%
Omega-3 - EPA
0.249g
0.867g
N/A
Omega-3 - DHA
0.119g
0.92g
N/A
Omega-3 - DPA
0.058g
0.216g
N/A
Macronutrient Comparison
Macronutrient breakdown side-by-side comparison
3
21%
5%
70%
4%
Protein:
20.7 g
Fats:
5.18 g
Carbs:
0 g
Water:
69.94 g
Other:
4.18 g
1
17%
20%
63%
Protein:
17.19 g
Fats:
19.62 g
Carbs:
0 g
Water:
62.85 g
Other:
0.34 g
Contains
more
Protein Protein
+20.4%
Contains
more
Water Water
+11.3%
Contains
more
Other Other
+1129.4%
Contains
more
Fats Fats
+278.8%
Fat Type Comparison
Fat type breakdown side-by-side comparison
1
26%
55%
19%
Saturated fat:
Sat. Fat
1.173 g
Monounsaturated fat:
Mono. Fat
2.486 g
Polyunsaturated fat:
Poly. Fat
0.885 g
2
24%
61%
15%
Saturated fat:
Sat. Fat
4.099 g
Monounsaturated fat:
Mono. Fat
10.328 g
Polyunsaturated fat:
Poly. Fat
2.618 g
Contains
less
Sat. Fat Saturated fat
-71.4%
Contains
more
Mono. Fat Monounsaturated fat
+315.4%
Contains
more
Poly. Fat Polyunsaturated fat
+195.8%