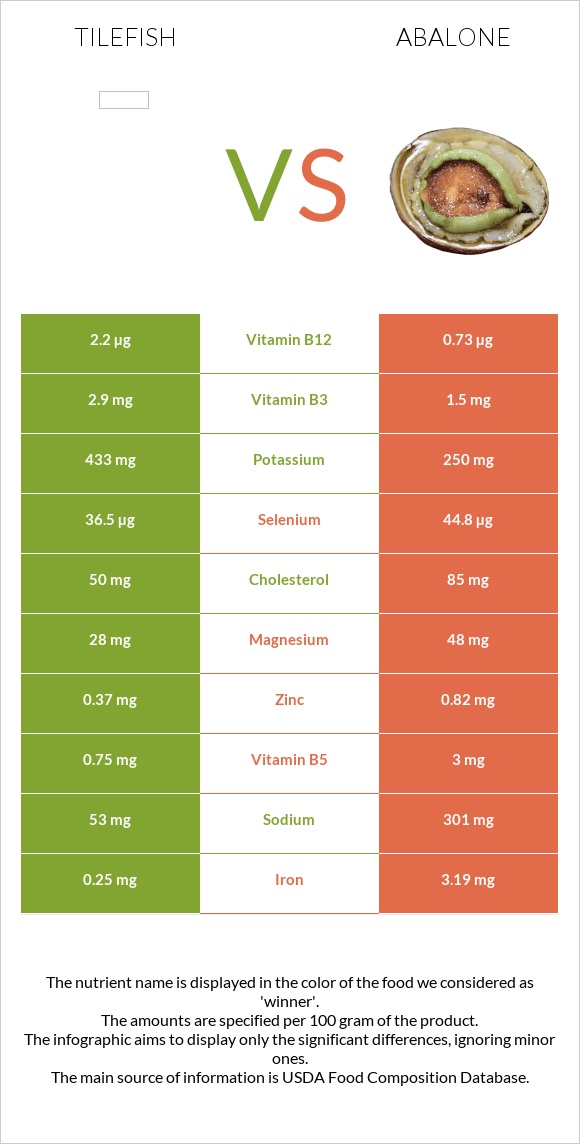
How are tilefish and abalone different? Tilefish is higher in vitamin B12, vitamin B6, vitamin B3, and potassium; however, abalone is richer in iron, vitamin B5, copper, and vitamin B1. Daily need coverage for vitamin B12 for tilefish is 75% higher. Tilefish contains 2 times more vitamin B6 than abalone. While tilefish contains 0.3mg of vitamin B6, abalone contains only 0.15mg. Tilefish has less cholesterol. Fish, tilefish, cooked, dry heat and Mollusks, abalone, mixed species, cooked, fried are the varieties used in this article.
Infographic
Mineral Comparison
Mineral comparison score is based on the number of minerals by which one or the other food is richer. The "coverage" charts below show how much of the daily needs can be covered by 300 grams of the food.
2
100 g
300 g
3 oz - 85g 0.5 fillet - 150g
Magnesium
Magnesium
Calcium
Calcium
Potassium
Potassium
Iron
Iron
Copper
Copper
Zinc
Zinc
Phosphorus
Phosphorus
Sodium
Sodium
Manganese
Manganese
Selenium
Selenium
24%
7.8%
45%
12%
17%
14%
101%
7.7%
2%
281%
6
100 g
300 g
3 oz - 85g
Magnesium
Magnesium
Calcium
Calcium
Potassium
Potassium
Iron
Iron
Copper
Copper
Zinc
Zinc
Phosphorus
Phosphorus
Sodium
Sodium
Manganese
Manganese
Selenium
Selenium
40%
11%
25%
143%
76%
26%
93%
77%
9.1%
283%
Vitamin Comparison
Vitamin comparison score is based on the number of vitamins by which one or the other food is richer. The "coverage" charts below show how much of the daily needs can be covered by 300 grams of the food.
6
100 g
300 g
3 oz - 85g 0.5 fillet - 150g
Vitamin C
Vit. C
Vitamin D
Vit. D
Vitamin A
Vit. A
Vitamin E
Vit. E
Vitamin B1
Vit. B1
Vitamin B2
Vit. B2
Vitamin B3
Vit. B3
Vitamin B5
Vit. B5
Vitamin B6
Vit. B6
Vitamin B12
Vit. B12
Vitamin K
Vit. K
Folate
Folate
0%
0%
7%
0%
35%
44%
66%
52%
69%
313%
0%
13%
3
100 g
300 g
3 oz - 85g
Vitamin C
Vit. C
Vitamin D
Vit. D
Vitamin A
Vit. A
Vitamin E
Vit. E
Vitamin B1
Vit. B1
Vitamin B2
Vit. B2
Vitamin B3
Vit. B3
Vitamin B5
Vit. B5
Vitamin B6
Vit. B6
Vitamin B12
Vit. B12
Vitamin K
Vit. K
Folate
Folate
6%
0%
0.67%
0%
55%
30%
36%
172%
35%
86%
0%
11%
All nutrients comparison - raw data values
Nutrient
DV% diff.
Vitamin B12
2.5µg
0.69µg
75%
Iron
0.31mg
3.8mg
44%
Vitamin B5
0.87mg
2.87mg
40%
Sodium
59mg
591mg
23%
Copper
0.052mg
0.228mg
20%
Vitamin B6
0.3mg
0.15mg
12%
Protein
24.49g
19.63g
10%
Cholesterol
64mg
94mg
10%
Vitamin B3
3.5mg
1.9mg
10%
Potassium
512mg
284mg
7%
Vitamin B1
0.14mg
0.22mg
7%
Magnesium
33mg
56mg
5%
Vitamin B2
0.19mg
0.13mg
5%
Carbs
0g
11.05g
4%
Zinc
0.53mg
0.95mg
4%
Saturated fat
0.868g
1.646g
4%
Monounsaturated fat
1.332g
2.741g
4%
Fats
4.69g
6.78g
3%
Phosphorus
236mg
217mg
3%
Polyunsaturated fat
1.246g
1.676g
3%
Calories
147kcal
189kcal
2%
Vitamin C
0mg
1.8mg
2%
Vitamin A
21µg
2µg
2%
Manganese
0.015mg
0.07mg
2%
Calcium
26mg
37mg
1%
Selenium
51.5µg
51.8µg
1%
Folate
17µg
14µg
1%
Protein per 100 calories
17g
10g
N/A
Calories per 10 g protein
60kcal
96kcal
N/A
Weight per 100 calories
68g
53g
N/A
Unsaturated / Saturated Fat ratio
3
2.7
N/A
Net carbs
0g
11.05g
N/A
Tryptophan
0.274mg
0.224mg
0%
Threonine
1.074mg
0.838mg
0%
Isoleucine
1.128mg
0.854mg
0%
Leucine
1.99mg
1.386mg
0%
Lysine
2.249mg
1.433mg
0%
Methionine
0.725mg
0.441mg
0%
Phenylalanine
0.956mg
0.715mg
0%
Valine
1.262mg
0.86mg
0%
Histidine
0.721mg
0.378mg
0%
Omega-3 - EPA
0.172g
0.054g
N/A
Omega-3 - DHA
0.733g
N/A
Omega-3 - DPA
0.143g
0.046g
N/A
Macronutrient Comparison
Macronutrient breakdown side-by-side comparison
2
24%
5%
70%
Protein:
24.49 g
Fats:
4.69 g
Carbs:
0 g
Water:
70.24 g
Other:
0.58 g
3
20%
7%
11%
60%
2%
Protein:
19.63 g
Fats:
6.78 g
Carbs:
11.05 g
Water:
60.1 g
Other:
2.44 g
Contains
more
Protein Protein
+24.8%
Contains
more
Water Water
+16.9%
Contains
more
Fats Fats
+44.6%
Contains
more
Carbs Carbs
+∞%
Contains
more
Other Other
+320.7%
Fat Type Comparison
Fat type breakdown side-by-side comparison
1
25%
39%
36%
Saturated fat:
Sat. Fat
0.868 g
Monounsaturated fat:
Mono. Fat
1.332 g
Polyunsaturated fat:
Poly. Fat
1.246 g
2
27%
45%
28%
Saturated fat:
Sat. Fat
1.646 g
Monounsaturated fat:
Mono. Fat
2.741 g
Polyunsaturated fat:
Poly. Fat
1.676 g
Contains
less
Sat. Fat Saturated fat
-47.3%
Contains
more
Mono. Fat Monounsaturated fat
+105.8%
Contains
more
Poly. Fat Polyunsaturated fat
+34.5%