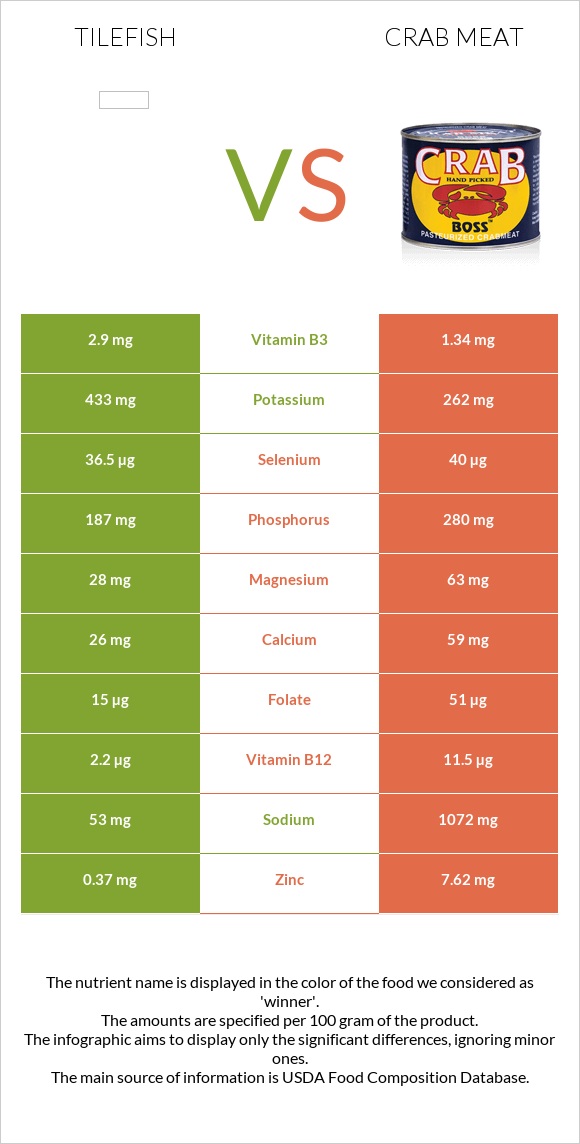
Significant differences between tilefish and crab meat Tilefish has more selenium, vitamin B3, vitamin B2, vitamin B5, and vitamin B6; however, crab meat is richer in vitamin B12, copper, zinc, and folate. Crab meat covers your daily vitamin B12 needs 375% more than tilefish. Crab meat has 3 times less vitamin B2 than tilefish. Tilefish has 0.19mg of vitamin B2, while crab meat has 0.055mg. Tilefish contains less sodium. Specific food types used in this comparison are Fish, tilefish, cooked, dry heat and Crustaceans, crab, alaska king, cooked, moist heat .
Infographic
Mineral Comparison
Mineral comparison score is based on the number of minerals by which one or the other food is richer. The "coverage" charts below show how much of the daily needs can be covered by 300 grams of the food.
3
100 g
300 g
3 oz - 85g 0.5 fillet - 150g
Magnesium
Magnesium
Calcium
Calcium
Potassium
Potassium
Iron
Iron
Copper
Copper
Zinc
Zinc
Phosphorus
Phosphorus
Sodium
Sodium
Manganese
Manganese
Selenium
Selenium
24%
7.8%
45%
12%
17%
14%
101%
7.7%
2%
281%
7
100 g
300 g
3 oz - 85g 1 leg - 134g
Magnesium
Magnesium
Calcium
Calcium
Potassium
Potassium
Iron
Iron
Copper
Copper
Zinc
Zinc
Phosphorus
Phosphorus
Sodium
Sodium
Manganese
Manganese
Selenium
Selenium
45%
18%
23%
29%
394%
208%
120%
140%
5.2%
218%
Vitamin Comparison
Vitamin comparison score is based on the number of vitamins by which one or the other food is richer. The "coverage" charts below show how much of the daily needs can be covered by 300 grams of the food.
6
100 g
300 g
3 oz - 85g 0.5 fillet - 150g
Vitamin C
Vit. C
Vitamin D
Vit. D
Vitamin A
Vit. A
Vitamin E
Vit. E
Vitamin B1
Vit. B1
Vitamin B2
Vit. B2
Vitamin B3
Vit. B3
Vitamin B5
Vit. B5
Vitamin B6
Vit. B6
Vitamin B12
Vit. B12
Vitamin K
Vit. K
Folate
Folate
0%
0%
7%
0%
35%
44%
66%
52%
69%
313%
0%
13%
3
100 g
300 g
3 oz - 85g 1 leg - 134g
Vitamin C
Vit. C
Vitamin D
Vit. D
Vitamin A
Vit. A
Vitamin E
Vit. E
Vitamin B1
Vit. B1
Vitamin B2
Vit. B2
Vitamin B3
Vit. B3
Vitamin B5
Vit. B5
Vitamin B6
Vit. B6
Vitamin B12
Vit. B12
Vitamin K
Vit. K
Folate
Folate
25%
0%
3%
0%
13%
13%
25%
24%
42%
1438%
0%
38%
All nutrients comparison - raw data values
Nutrient
DV% diff.
Vitamin B12
2.5µg
11.5µg
375%
Copper
0.052mg
1.182mg
126%
Zinc
0.53mg
7.62mg
64%
Sodium
59mg
1072mg
44%
Selenium
51.5µg
40µg
21%
Vitamin B3
3.5mg
1.34mg
14%
Protein
24.49g
19.35g
10%
Vitamin B2
0.19mg
0.055mg
10%
Vitamin B5
0.87mg
0.4mg
9%
Vitamin B6
0.3mg
0.18mg
9%
Folate
17µg
51µg
9%
Vitamin C
0mg
7.6mg
8%
Magnesium
33mg
63mg
7%
Potassium
512mg
262mg
7%
Vitamin B1
0.14mg
0.053mg
7%
Iron
0.31mg
0.76mg
6%
Phosphorus
236mg
280mg
6%
Fats
4.69g
1.54g
5%
Polyunsaturated fat
1.246g
0.536g
5%
Cholesterol
64mg
53mg
4%
Calories
147kcal
97kcal
3%
Calcium
26mg
59mg
3%
Saturated fat
0.868g
0.133g
3%
Monounsaturated fat
1.332g
0.185g
3%
Vitamin A
21µg
9µg
1%
Manganese
0.015mg
0.04mg
1%
Protein per 100 calories
17g
20g
N/A
Calories per 10 g protein
60kcal
50kcal
N/A
Weight per 100 calories
68g
103g
N/A
Unsaturated / Saturated Fat ratio
3
5.4
N/A
Tryptophan
0.274mg
0.269mg
0%
Threonine
1.074mg
0.783mg
0%
Isoleucine
1.128mg
0.938mg
0%
Leucine
1.99mg
1.536mg
0%
Lysine
2.249mg
1.684mg
0%
Methionine
0.725mg
0.545mg
0%
Phenylalanine
0.956mg
0.817mg
0%
Valine
1.262mg
0.91mg
0%
Histidine
0.721mg
0.393mg
0%
Omega-3 - EPA
0.172g
0.295g
N/A
Omega-3 - DHA
0.733g
0.118g
N/A
Omega-3 - DPA
0.143g
0.031g
N/A
Macronutrient Comparison
Macronutrient breakdown side-by-side comparison
2
24%
5%
70%
Protein:
24.49 g
Fats:
4.69 g
Carbs:
0 g
Water:
70.24 g
Other:
0.58 g
2
19%
78%
Protein:
19.35 g
Fats:
1.54 g
Carbs:
0 g
Water:
77.55 g
Other:
1.56 g
Contains
more
Protein Protein
+26.6%
Contains
more
Fats Fats
+204.5%
Contains
more
Water Water
+10.4%
Contains
more
Other Other
+169%
Fat Type Comparison
Fat type breakdown side-by-side comparison
2
25%
39%
36%
Saturated fat:
Sat. Fat
0.868 g
Monounsaturated fat:
Mono. Fat
1.332 g
Polyunsaturated fat:
Poly. Fat
1.246 g
1
16%
22%
63%
Saturated fat:
Sat. Fat
0.133 g
Monounsaturated fat:
Mono. Fat
0.185 g
Polyunsaturated fat:
Poly. Fat
0.536 g
Contains
more
Mono. Fat Monounsaturated fat
+620%
Contains
more
Poly. Fat Polyunsaturated fat
+132.5%
Contains
less
Sat. Fat Saturated fat
-84.7%