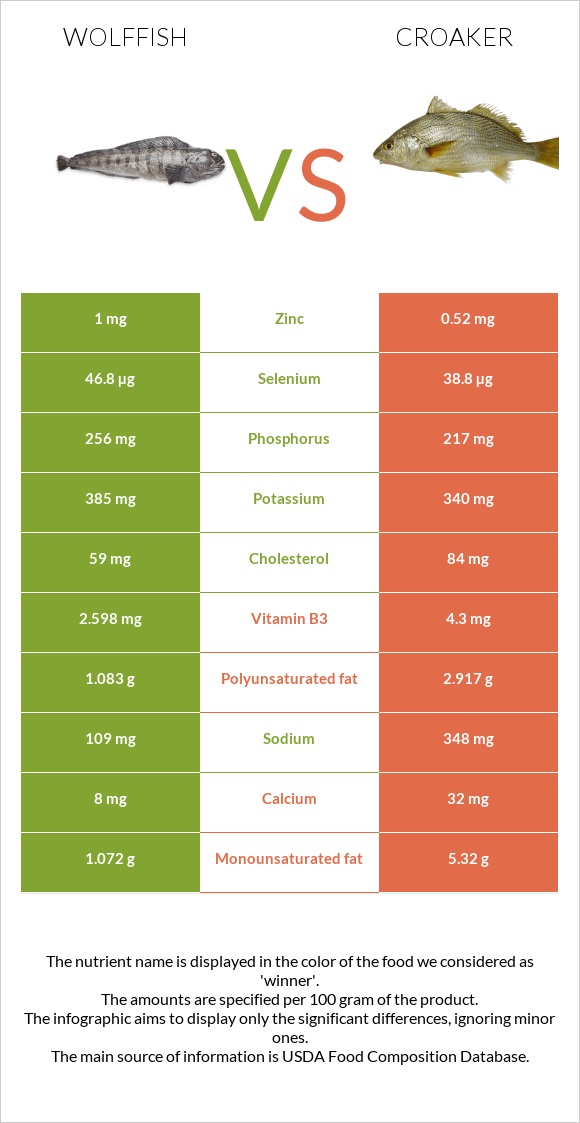
A recap on the differences between wolffish and croaker Wolffish has more vitamin B6, selenium, vitamin B12, vitamin B1, and vitamin A; however, croaker is higher in vitamin B3 and iron. Wolffish covers your daily vitamin B6 needs 16% more than croaker. Croaker contains 6 times less vitamin A than wolffish. Wolffish contains 433 IU of vitamin A, while croaker contains 75 IU. Wolffish has less cholesterol. Food varieties used in this article are Fish, wolffish, Atlantic, cooked, dry heat and Fish, croaker, Atlantic, cooked, breaded, and fried .
Infographic
Mineral Comparison
Mineral comparison score is based on the number of minerals by which one or the other food is richer. The "coverage" charts below show how much of the daily needs can be covered by 300 grams of the food.
5
100 g
300 g
3 oz - 85g 0.5 fillet - 119g
Magnesium
Magnesium
Calcium
Calcium
Potassium
Potassium
Iron
Iron
Copper
Copper
Zinc
Zinc
Phosphorus
Phosphorus
Sodium
Sodium
Manganese
Manganese
Selenium
Selenium
27%
2.4%
34%
4.5%
12%
27%
110%
14%
2.5%
255%
5
100 g
300 g
3 oz - 85g 1 fillet - 87g
Magnesium
Magnesium
Calcium
Calcium
Potassium
Potassium
Iron
Iron
Copper
Copper
Zinc
Zinc
Phosphorus
Phosphorus
Sodium
Sodium
Manganese
Manganese
Selenium
Selenium
30%
9.6%
30%
32%
22%
14%
93%
45%
10%
212%
Vitamin Comparison
Vitamin comparison score is based on the number of vitamins by which one or the other food is richer. The "coverage" charts below show how much of the daily needs can be covered by 300 grams of the food.
4
100 g
300 g
3 oz - 85g 0.5 fillet - 119g
Vitamin C
Vit. C
Vitamin D
Vit. D
Vitamin A
Vit. A
Vitamin E
Vit. E
Vitamin B1
Vit. B1
Vitamin B2
Vit. B2
Vitamin B3
Vit. B3
Vitamin B5
Vit. B5
Vitamin B6
Vit. B6
Vitamin B12
Vit. B12
Vitamin K
Vit. K
Folate
Folate
0%
0%
43%
0%
52%
22%
49%
39%
107%
294%
0%
4.5%
4
100 g
300 g
3 oz - 85g 1 fillet - 87g
Vitamin C
Vit. C
Vitamin D
Vit. D
Vitamin A
Vit. A
Vitamin E
Vit. E
Vitamin B1
Vit. B1
Vitamin B2
Vit. B2
Vitamin B3
Vit. B3
Vitamin B5
Vit. B5
Vitamin B6
Vit. B6
Vitamin B12
Vit. B12
Vitamin K
Vit. K
Folate
Folate
0%
0%
7.7%
0%
23%
30%
81%
44%
60%
263%
0%
26%
All nutrients comparison - raw data values
Nutrient
DV% diff.
Vitamin B6
0.462mg
0.26mg
16%
Fats
3.06g
12.67g
15%
Selenium
46.8µg
38.8µg
15%
Saturated fat
0.468g
3.476g
14%
Vitamin A
130µg
23µg
12%
Polyunsaturated fat
1.083g
2.917g
12%
Vitamin B3
2.598mg
4.3mg
11%
Monounsaturated fat
1.072g
5.32g
11%
Sodium
109mg
348mg
10%
Vitamin B1
0.208mg
0.09mg
10%
Vitamin B12
2.35µg
2.1µg
10%
Iron
0.12mg
0.86mg
9%
Protein
22.44g
18.2g
8%
Cholesterol
59mg
84mg
8%
Folate
6µg
34µg
7%
Phosphorus
256mg
217mg
6%
Calories
123kcal
221kcal
5%
Zinc
1mg
0.52mg
4%
Carbs
0g
7.54g
3%
Copper
0.037mg
0.065mg
3%
Manganese
0.019mg
0.08mg
3%
Vitamin B2
0.097mg
0.13mg
3%
Calcium
8mg
32mg
2%
Fiber
0g
0.4g
2%
Vitamin B5
0.658mg
0.74mg
2%
Magnesium
38mg
42mg
1%
Potassium
385mg
340mg
1%
Protein per 100 calories
18g
8.2g
N/A
Calories per 10 g protein
55kcal
121kcal
N/A
Weight per 100 calories
81g
45g
N/A
Unsaturated / Saturated Fat ratio
4.6
2.4
N/A
Net carbs
0g
7.14g
N/A
Tryptophan
0.251mg
0.208mg
0%
Threonine
0.984mg
0.788mg
0%
Isoleucine
1.034mg
0.847mg
0%
Leucine
1.824mg
1.48mg
0%
Lysine
2.061mg
1.571mg
0%
Methionine
0.664mg
0.525mg
0%
Phenylalanine
0.876mg
0.742mg
0%
Valine
1.156mg
0.947mg
0%
Histidine
0.661mg
0.525mg
0%
Omega-3 - EPA
0.393g
0.113g
N/A
Omega-3 - DHA
0.405g
0.089g
N/A
Omega-3 - DPA
0.055g
0.079g
N/A
Macronutrient Comparison
Macronutrient breakdown side-by-side comparison
2
22%
3%
74%
Protein:
22.44 g
Fats:
3.06 g
Carbs:
0 g
Water:
74.23 g
Other:
0.27 g
3
18%
13%
8%
60%
2%
Protein:
18.2 g
Fats:
12.67 g
Carbs:
7.54 g
Water:
59.76 g
Other:
1.83 g
Contains
more
Protein Protein
+23.3%
Contains
more
Water Water
+24.2%
Contains
more
Fats Fats
+314.1%
Contains
more
Carbs Carbs
+∞%
Contains
more
Other Other
+577.8%
Fat Type Comparison
Fat type breakdown side-by-side comparison
1
18%
41%
41%
Saturated fat:
Sat. Fat
0.468 g
Monounsaturated fat:
Mono. Fat
1.072 g
Polyunsaturated fat:
Poly. Fat
1.083 g
2
30%
45%
25%
Saturated fat:
Sat. Fat
3.476 g
Monounsaturated fat:
Mono. Fat
5.32 g
Polyunsaturated fat:
Poly. Fat
2.917 g
Contains
less
Sat. Fat Saturated fat
-86.5%
Contains
more
Mono. Fat Monounsaturated fat
+396.3%
Contains
more
Poly. Fat Polyunsaturated fat
+169.3%