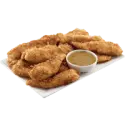
Chicken fingers nutrition: calories, carbs, GI, protein, fiber, fats
Fast foods, chicken tenders
Important nutritional characteristics for Chicken fingers
|
Glycemic index ⓘ
Source: The GI for chicken nuggets https://www.sciencedirect.com/science/article/pii/S0002916522004944
Check out our Glycemic index chart page for the full list.
|
46 (low) |
| Glycemic load | 14 (medium) |
| Insulin index ⓘ https://ses.library.usyd.edu.au/handle/2123/11945 – II for chicken nuggets is 41 | 41 |
| Calories ⓘ Calories for selected serving | 81 kcal |
| Net Carbs ⓘ Net Carbs = Total Carbohydrates – Fiber – Sugar Alcohols | 5 grams |
| Default serving size ⓘ Serving sizes are mostly taken from FDA's Reference Amounts Customarily Consumed (RACCs) | 1 serving (184 grams) |
| Acidity (Based on PRAL) ⓘ PRAL (Potential renal acid load) is calculated using a formula. On the PRAL scale the higher the positive value, the more is the acidifying effect on the body. The lower the negative value, the higher the alkalinity of the food. 0 is neutral. | 11.1 (acidic) |
Sodium ⓘHigher in Sodium content than 90% of foods
Vitamin B3 ⓘHigher in Vitamin B3 content than 85% of foods
Polyunsaturated fat ⓘHigher in Polyunsaturated fat content than 84% of foods
Phosphorus ⓘHigher in Phosphorus content than 82% of foods
Potassium ⓘHigher in Potassium content than 79% of foods
Chicken fingers calories (kcal)
| Serving Size | Calories | Weight |
|---|---|---|
| Calories in 100 grams | 271 | |
| Calories in 1 strip | 81 | 30 g |
| Calories in 1 serving | 499 | 184 g |
Chicken fingers Glycemic index (GI)
Source:
The GI for chicken nuggets https://www.sciencedirect.com/science/article/pii/S0002916522004944
Check out our Glycemic index chart page for the full list.
Chicken fingers Glycemic load (GL)
Mineral coverage chart
Mineral chart - relative view
Vitamin coverage chart
Vitamin A:
9.9IU of 5,000IU
0.2%
Vitamin E :
2.9mg of 15mg
19%
Vitamin D:
0.18µg of 10µg
1.8%
Vitamin C:
0.99mg of 90mg
1.1%
Vitamin B1:
0.1mg of 1mg
8.3%
Vitamin B2:
0.16mg of 1mg
12%
Vitamin B3:
7.4mg of 16mg
46%
Vitamin B5:
1.1mg of 5mg
22%
Vitamin B6:
0.38mg of 1mg
29%
Folate:
17µg of 400µg
4.3%
Vitamin B12:
0.14µg of 2µg
6%
Choline:
39mg of 550mg
7.2%
Vitamin K:
7.2µg of 120µg
6%
Vitamin chart - relative view
Vitamin D
0.06 µg
TOP 53%
Macronutrients chart
Protein:
Daily Value: 12%
5.8 g of 50 g
5.8 g (12% of DV )
Fats:
Daily Value: 6%
4.2 g of 65 g
4.2 g (6% of DV )
Carbs:
Daily Value: 2%
5.2 g of 300 g
5.2 g (2% of DV )
Water:
Daily Value: 1%
14 g of 2,000 g
14 g (1% of DV )
Other:
0.9 g
0.9 g
Protein quality breakdown
Tryptophan:
200mg of 280mg
71%
Threonine:
723mg of 1,050mg
69%
Isoleucine:
761mg of 1,400mg
54%
Leucine:
1398mg of 2,730mg
51%
Lysine:
1454mg of 2,100mg
69%
Methionine:
466mg of 1,050mg
44%
Phenylalanine:
1293mg of 1,750mg
74%
Valine:
817mg of 1,820mg
45%
Histidine:
590mg of 700mg
84%
Fat type information
Saturated Fat:
0.75 g
Monounsaturated Fat:
1.4 g
Polyunsaturated fat:
1.7 g
Carbohydrate type breakdown
Starch:
5.1 g
Sucrose:
0.12 g
Glucose:
0 g
Fructose:
0 g
Lactose:
0 g
Maltose:
0 g
Galactose:
0 g
Fiber content ratio for Chicken fingers
Sugar:
0.12 g
Fiber:
0.36 g
Other:
4.7 g
All nutrients for Chicken fingers per selected serving size (1 strip - 30g)
| Nutrient | Value | DV% | In TOP % of foods | Comparison |
| Calories | 81kcal | 4% | 34% |
5.8 times more than Orange
|
| Protein | 5.8g | 14% | 27% |
6.8 times more than Broccoli
|
| Fats | 4.2g | 6% | 25% |
2.4 times less than Cheese
|
| Vitamin C | 0.33mg | 0% | 40% |
48.2 times less than Lemon
|
| Net carbs | 4.8g | N/A | 36% |
3.4 times less than Chocolate
|
| Carbs | 5.2g | 2% | 38% |
1.6 times less than Rice
|
| Cholesterol | 14mg | 5% | 37% |
7.8 times less than Egg
|
| Vitamin D | 0.06µg | 1% | 53% |
11 times less than Egg
|
| Magnesium | 8.4mg | 2% | 35% |
5 times less than Almond
|
| Calcium | 5.1mg | 1% | 59% |
7.4 times less than Milk
|
| Potassium | 112mg | 3% | 21% |
2.5 times more than Cucumber
|
| Iron | 0.22mg | 3% | 69% |
3.6 times less than Beef broiled
|
| Sugar | 0.12g | N/A | 72% |
22.4 times less than Coca-Cola
|
| Fiber | 0.36g | 1% | 47% |
2 times less than Orange
|
| Copper | 0.02mg | 2% | 70% |
2.1 times less than Shiitake
|
| Zinc | 0.21mg | 2% | 61% |
8.9 times less than Beef broiled
|
| Starch | 5.1g | 2% | 92% |
1.1 times more than Potato
|
| Phosphorus | 85mg | 12% | 18% |
1.5 times more than Chicken meat
|
| Sodium | 231mg | 10% | 10% |
1.6 times more than White Bread
|
| Vitamin A | 3.3IU | 0% | 63% |
1518.7 times less than Carrot
|
| Vitamin A RAE | 0.9µg | 0% | 62% | |
| Vitamin E | 0.95mg | 6% | 38% |
2.2 times more than Kiwifruit
|
| Selenium | 5.3µg | 10% | 49% | |
| Manganese | 0.07mg | 3% | 49% | |
| Vitamin B1 | 0.03mg | 3% | 46% |
2.4 times less than Pea raw
|
| Vitamin B2 | 0.05mg | 4% | 51% |
1.4 times more than Avocado
|
| Vitamin B3 | 2.5mg | 15% | 15% |
1.2 times less than Turkey meat
|
| Vitamin B5 | 0.37mg | 7% | 31% |
1.1 times more than Sunflower seed
|
| Vitamin B6 | 0.13mg | 10% | 29% |
3.6 times more than Oat
|
| Vitamin B12 | 0.05µg | 2% | 60% |
4.4 times less than Pork
|
| Vitamin K | 2.4µg | 2% | 51% |
12.7 times less than Broccoli
|
| Folate | 5.7µg | 1% | 49% |
3.2 times less than Brussels sprout
|
| Trans Fat | 0.02g | N/A | 66% |
286.3 times less than Margarine
|
| Choline | 13mg | 2% | 67% | |
| Saturated Fat | 0.75g | 4% | 42% |
2.4 times less than Beef broiled
|
| Monounsaturated Fat | 1.4g | N/A | 32% |
2 times less than Avocado
|
| Polyunsaturated fat | 1.7g | N/A | 16% |
8.2 times less than Walnut
|
| Tryptophan | 0.07mg | 0% | 61% |
1.4 times less than Chicken meat
|
| Threonine | 0.24mg | 0% | 65% |
1.1 times more than Beef broiled
|
| Isoleucine | 0.25mg | 0% | 65% |
1.1 times less than Salmon raw
|
| Leucine | 0.47mg | 0% | 64% |
1.6 times less than Tuna Bluefin
|
| Lysine | 0.48mg | 0% | 64% |
3.6 times more than Tofu
|
| Methionine | 0.16mg | 0% | 64% |
5.4 times more than Quinoa
|
| Phenylalanine | 0.43mg | 0% | 42% |
2.2 times more than Egg
|
| Valine | 0.27mg | 0% | 67% |
2.2 times less than Soybean raw
|
| Histidine | 0.2mg | 0% | 62% |
1.1 times less than Turkey meat
|
| Fructose | 0g | 0% | 100% |
N/A
|
| Omega-3 - EPA | 0g | N/A | 100% |
N/A
|
| Omega-3 - DHA | 0g | N/A | 47% |
730 times less than Salmon
|
| Omega-3 - ALA | 0.06g | N/A | 82% |
43.3 times less than Canola oil
|
| Omega-3 - DPA | 0g | N/A | 51% |
56.7 times less than Salmon
|
| Omega-3 - Eicosatrienoic acid | 0g | N/A | 100% | |
| Omega-6 - Gamma-linoleic acid | 0g | N/A | 84% | |
| Omega-6 - Dihomo-gamma-linoleic acid | 0g | N/A | 93% | |
| Omega-6 - Eicosadienoic acid | 0g | N/A | 80% | |
| Omega-6 - Linoleic acid | 1.6g | N/A | 81% |
2.3 times less than Almond
|
Check out similar food or compare with current
NUTRITION FACTS LABEL
Nutrition Facts
___servings per container
Serving Size ______________
Serving Size ______________
Amount Per 100g
Calories 81
% Daily Value*
6.4%
Total Fat
4.2g
3.4%
Saturated Fat 0.75g
0
Trans Fat
0g
4.8%
Cholesterol 14mg
10%
Sodium 231mg
1.7%
Total Carbohydrate
5.2g
1.4%
Dietary Fiber
0.36g
Total Sugars 0g
Includes ? g Added Sugars
Protein
5.8g
Vitamin D
2.1mcg
0.35%
Calcium
5.1mg
0.51%
Iron
0.22mg
2.7%
Potassium
112mg
3.3%
*
The % Daily Value (DV) tells you how much a nutrient in a serving of food contributes to a daily diet. 2,000 calories a day is used for general nutrition advice.
Health checks
ⓘ
Dietary cholesterol is not associated with an increased risk of coronary heart disease in healthy individuals. However, dietary cholesterol is common in foods that are high in harmful saturated fats.
Source
Low in Cholesterol
ⓘ
Trans fat consumption increases the risk of cardiovascular disease and mortality by negatively affecting blood lipid levels.
Source
No Trans Fats
ⓘ
Saturated fat intake can raise total cholesterol and LDL (low-density lipoprotein) levels, leading to an increased risk of atherosclerosis. Dietary guidelines recommend limiting saturated fats to under 10% of calories a day.
Source
Low in Saturated Fats
ⓘ
While the consumption of moderate amounts of added sugars is not detrimental to health, an excessive intake can increase the risk of obesity, and therefore, diabetes.
Source
Low in Sugars
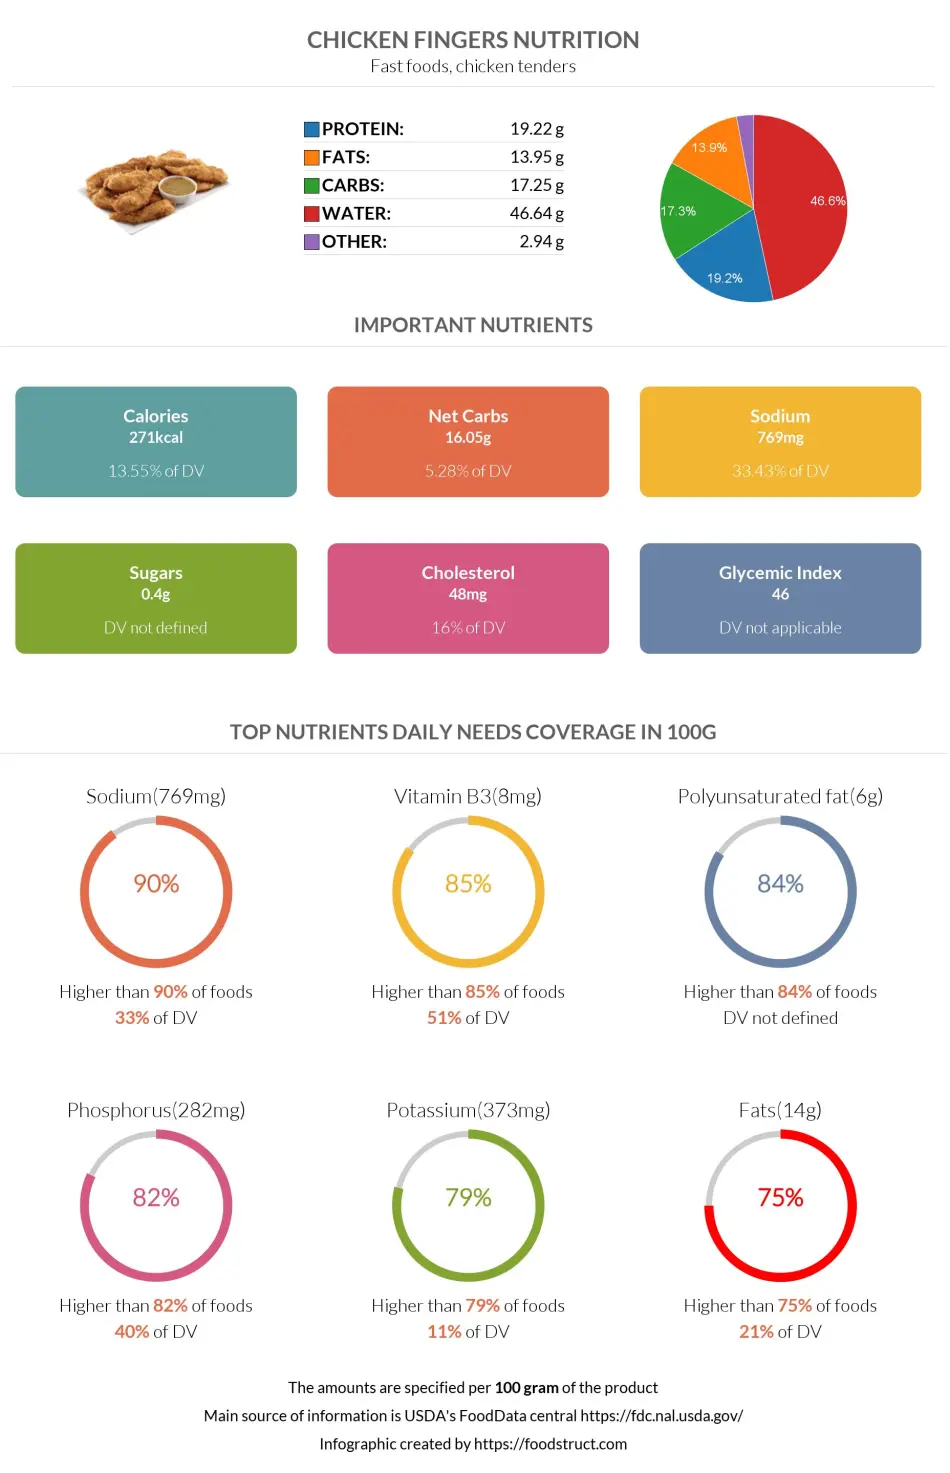
Chicken fingers nutrition infographic
Infographic link
References
All the values for which the sources are not specified explicitly are taken from FDA’s Food Central. The exact link to the food presented on this page can be found below.