Cocoa bean nutrition: calories, carbs, GI, protein, fiber, fats
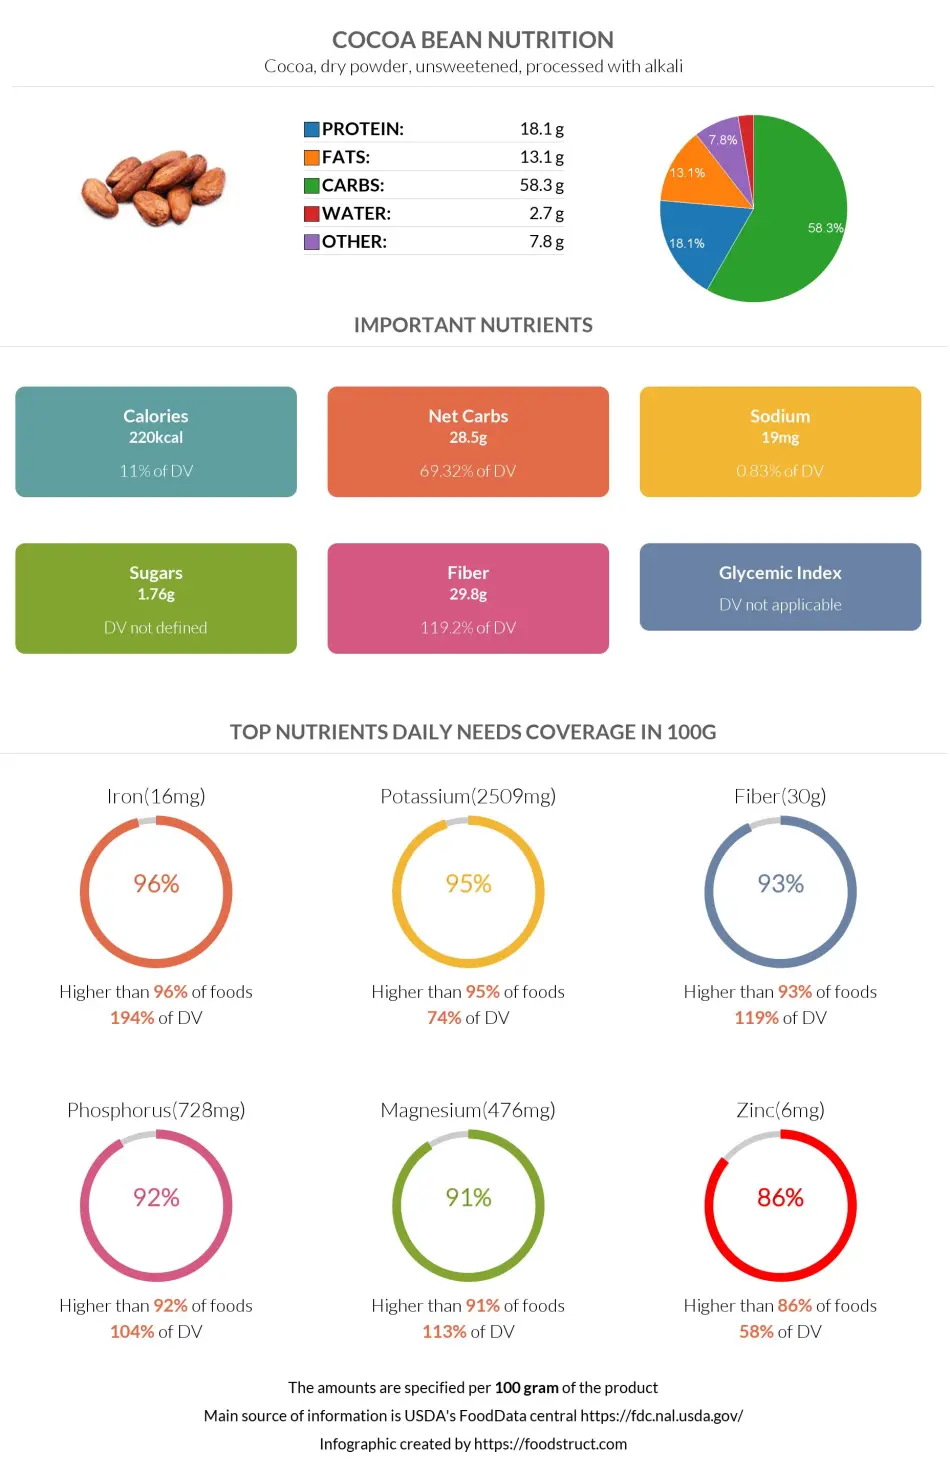
Cocoa, dry powder, unsweetened, processed with alkali
Important nutritional characteristics for Cocoa bean

| Calories ⓘ Calories for selected serving | 12 |
| Net Carbs ⓘ Net Carbs = Total Carbohydrates – Fiber – Sugar Alcohols | 2 grams |
| Default serving size ⓘ Serving sizes are mostly taken from FDA's Reference Amounts Customarily Consumed (RACCs) | 1 tbsp (5.4 grams) |
| Acidity (Based on PRAL) ⓘ PRAL (Potential renal acid load) is calculated using a formula. On the PRAL scale the higher the positive value, the more is the acidifying effect on the body. The lower the negative value, the higher the alkalinity of the food. 0 is neutral. | -30.7 (alkaline) |
| Oxalates ⓘ https://www.sciencedirect.com/science/article/abs/pii/S0889157511000822 | 42 mg |
Iron ⓘHigher in Iron content than 96% of foods
Potassium ⓘHigher in Potassium content than 95% of foods
Fiber ⓘHigher in Fiber content than 93% of foods
Phosphorus ⓘHigher in Phosphorus content than 92% of foods
Magnesium ⓘHigher in Magnesium content than 91% of foods
Cocoa bean calories (kcal)
| Serving Size | Calories | Weight |
|---|---|---|
| Calories in 100 grams | 220 | |
| Calories in 1 cup | 189 | 86 g |
| Calories in 1 tbsp | 12 | 5.4 g |
Mineral coverage chart
Mineral chart - relative view
Vitamin coverage chart
Vitamin A:
0IU of 5,000IU
0%
Vitamin E :
0.02mg of 15mg
0.11%
Vitamin D:
0µg of 10µg
0%
Vitamin C:
0mg of 90mg
0%
Vitamin B1:
0.02mg of 1mg
1.5%
Vitamin B2:
0.07mg of 1mg
5.7%
Vitamin B3:
0.39mg of 16mg
2.4%
Vitamin B5:
0.04mg of 5mg
0.82%
Vitamin B6:
0.02mg of 1mg
1.5%
Folate:
5.2µg of 400µg
1.3%
Vitamin B12:
0µg of 2µg
0%
Choline:
1.8mg of 550mg
0.34%
Vitamin K:
0.39µg of 120µg
0.32%
Vitamin chart - relative view
Vitamin D
0 µg
TOP 100%
Macronutrients chart
Protein:
Daily Value: 2%
1 g of 50 g
1 g (2% of DV )
Fats:
Daily Value: 1%
0.7 g of 65 g
0.7 g (1% of DV )
Carbs:
Daily Value: 1%
3.1 g of 300 g
3.1 g (1% of DV )
Water:
Daily Value: 0%
0.1 g of 2,000 g
0.1 g (0% of DV )
Other:
0.4 g
0.4 g
Protein quality breakdown
Tryptophan:
44mg of 280mg
16%
Threonine:
116mg of 1,050mg
11%
Isoleucine:
114mg of 1,400mg
8.1%
Leucine:
178mg of 2,730mg
6.5%
Lysine:
147mg of 2,100mg
7%
Methionine:
30mg of 1,050mg
2.9%
Phenylalanine:
141mg of 1,750mg
8%
Valine:
176mg of 1,820mg
9.7%
Histidine:
51mg of 700mg
7.2%
Fat type information
Saturated Fat:
0.42 g
Monounsaturated Fat:
0.24 g
Polyunsaturated fat:
0.02 g
Fiber content ratio for Cocoa bean
Sugar:
0.1 g
Fiber:
1.6 g
Other:
1.4 g
All nutrients for Cocoa bean per selected serving size (1 tbsp - 5.4g)
| Nutrient | Value | DV% | In TOP % of foods | Comparison |
| Calories | 12kcal | 1% | 44% |
4.7 times more than Orange
|
| Protein | 0.98g | 2% | 29% |
6.4 times more than Broccoli
|
| Fats | 0.71g | 1% | 26% |
2.5 times less than Cheese
|
| Vitamin C | 0mg | 0% | 100% |
N/A
|
| Net carbs | 1.5g | N/A | 26% |
1.9 times less than Chocolate
|
| Carbs | 3.1g | 1% | 17% |
2.1 times more than Rice
|
| Cholesterol | 0mg | 0% | 100% |
N/A
|
| Vitamin D | 0µg | 0% | 100% |
N/A
|
| Magnesium | 26mg | 6% | 9% |
3.4 times more than Almond
|
| Calcium | 6mg | 1% | 20% |
1.1 times less than Milk
|
| Potassium | 135mg | 4% | 5% |
17.1 times more than Cucumber
|
| Iron | 0.84mg | 10% | 4% |
6 times more than Beef broiled
|
| Sugar | 0.1g | N/A | 61% |
5.1 times less than Coca-Cola
|
| Fiber | 1.6g | 6% | 7% |
12.4 times more than Orange
|
| Copper | 0.19mg | 22% | 15% |
25.4 times more than Shiitake
|
| Zinc | 0.34mg | 3% | 14% |
Equal to Beef broiled
|
| Phosphorus | 39mg | 6% | 8% |
4 times more than Chicken meat
|
| Sodium | 1mg | 0% | 81% |
25.8 times less than White Bread
|
| Vitamin A | 0IU | 0% | 100% |
N/A
|
| Vitamin A RAE | 0µg | 0% | 100% | |
| Vitamin E | 0.01mg | 0% | 86% |
14.6 times less than Kiwifruit
|
| Selenium | 0.71µg | 1% | 56% | |
| Manganese | 0.2mg | 9% | 26% | |
| Vitamin B1 | 0.01mg | 0% | 46% |
2.4 times less than Pea raw
|
| Vitamin B2 | 0.02mg | 2% | 16% |
3.5 times more than Avocado
|
| Vitamin B3 | 0.13mg | 1% | 55% |
4 times less than Turkey meat
|
| Vitamin B5 | 0.01mg | 0% | 77% |
4.4 times less than Sunflower seed
|
| Vitamin B6 | 0.01mg | 0% | 60% |
Equal to Oat
|
| Vitamin B12 | 0µg | 0% | 100% |
N/A
|
| Vitamin K | 0.13µg | 0% | 63% |
42.3 times less than Broccoli
|
| Folate | 1.7µg | 0% | 41% |
1.9 times less than Brussels sprout
|
| Saturated Fat | 0.42g | 2% | 16% |
1.3 times more than Beef broiled
|
| Choline | 0.62mg | 0% | 84% | |
| Monounsaturated Fat | 0.24g | N/A | 35% |
2.2 times less than Avocado
|
| Polyunsaturated fat | 0.02g | N/A | 65% |
112.3 times less than Walnut
|
| Tryptophan | 0.01mg | 0% | 54% |
1.1 times less than Chicken meat
|
| Threonine | 0.04mg | 0% | 68% |
Equal to Beef broiled
|
| Isoleucine | 0.04mg | 0% | 70% |
1.3 times less than Salmon raw
|
| Leucine | 0.06mg | 0% | 72% |
2.2 times less than Tuna Bluefin
|
| Lysine | 0.05mg | 0% | 72% |
2 times more than Tofu
|
| Methionine | 0.01mg | 0% | 76% |
1.9 times more than Quinoa
|
| Phenylalanine | 0.05mg | 0% | 60% |
1.3 times more than Egg
|
| Valine | 0.06mg | 0% | 59% |
1.9 times less than Soybean raw
|
| Histidine | 0.02mg | 0% | 74% |
2.4 times less than Turkey meat
|
| Omega-3 - EPA | 0g | N/A | 100% |
N/A
|
| Omega-3 - DHA | 0g | N/A | 100% |
N/A
|
| Omega-3 - DPA | 0g | N/A | 100% |
N/A
|
Check out similar food or compare with current


NUTRITION FACTS LABEL
Nutrition Facts
___servings per container
Serving Size ______________
Serving Size ______________
Amount Per 100g
Calories 12
% Daily Value*
1.1%
Total Fat
0.71g
1.9%
Saturated Fat 0.42g
0
Trans Fat
0g
0
Cholesterol 0mg
0.04%
Sodium 1mg
1%
Total Carbohydrate
3.1g
6.4%
Dietary Fiber
1.6g
Total Sugars 0g
Includes ? g Added Sugars
Protein
0.98g
Vitamin D
0mcg
0
Calcium
6mg
0.6%
Iron
0.84mg
10%
Potassium
135mg
4%
*
The % Daily Value (DV) tells you how much a nutrient in a serving of food contributes to a daily diet. 2,000 calories a day is used for general nutrition advice.
Health checks
ⓘ
Dietary cholesterol is not associated with an increased risk of coronary heart disease in healthy individuals. However, dietary cholesterol is common in foods that are high in harmful saturated fats.
Source
Low in Cholesterol
ⓘ
Trans fat consumption increases the risk of cardiovascular disease and mortality by negatively affecting blood lipid levels.
Source
No Trans Fats
ⓘ
Saturated fat intake can raise total cholesterol and LDL (low-density lipoprotein) levels, leading to an increased risk of atherosclerosis. Dietary guidelines recommend limiting saturated fats to under 10% of calories a day.
Source
Low in Saturated Fats
ⓘ
While the consumption of moderate amounts of added sugars is not detrimental to health, an excessive intake can increase the risk of obesity, and therefore, diabetes.
Source
Low in Sugars
Cocoa bean nutrition infographic
Infographic link
References
All the values for which the sources are not specified explicitly are taken from FDA’s Food Central. The exact link to the food presented on this page can be found below.