Duck meat nutrition: calories, carbs, GI, protein, fiber, fats
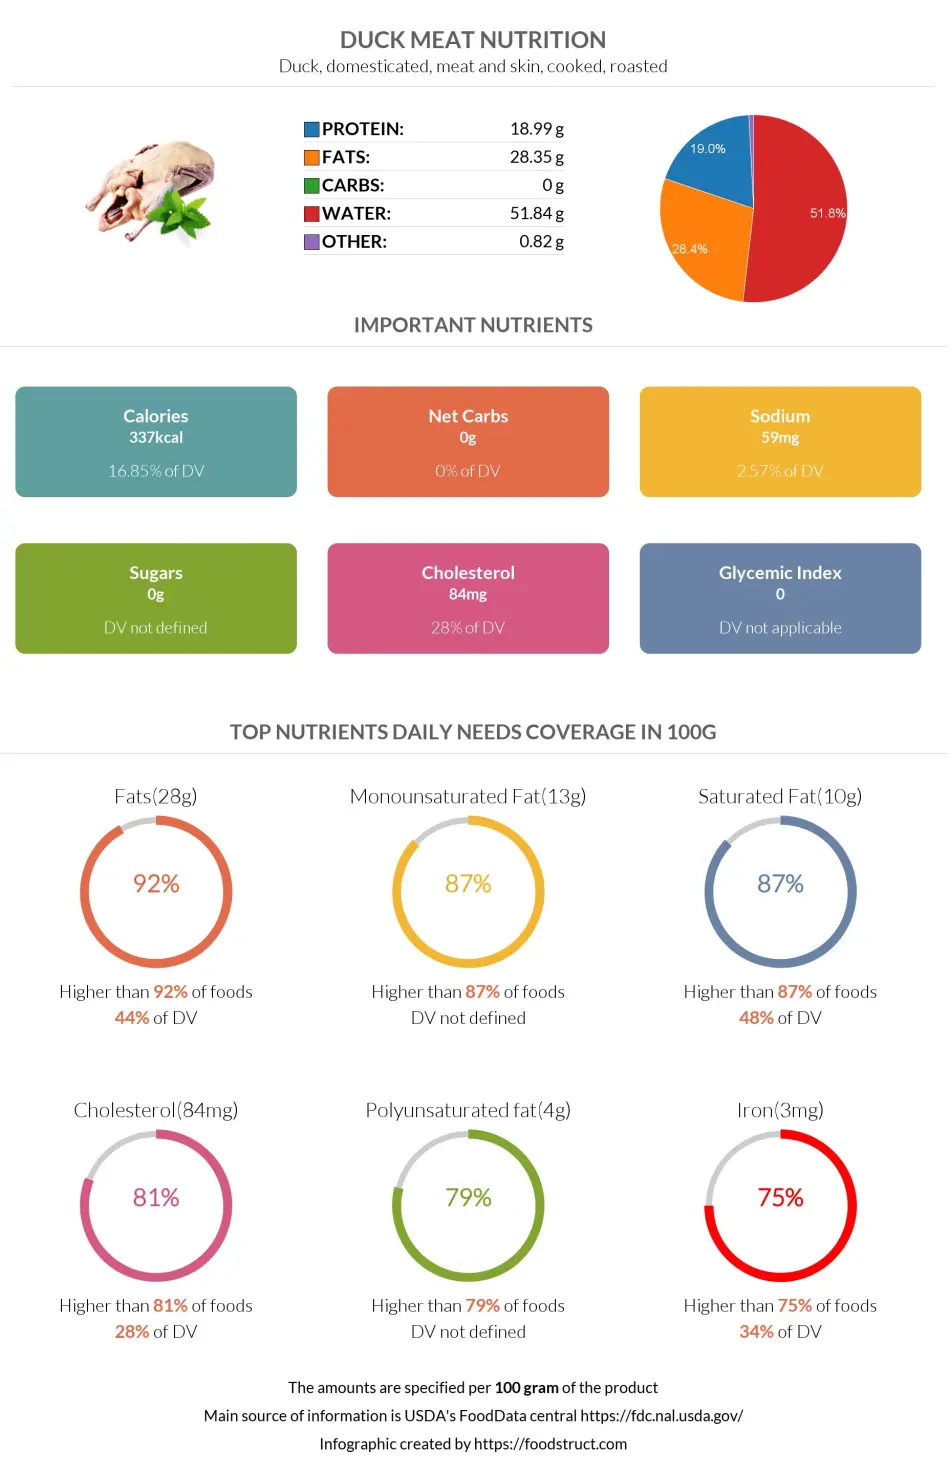
Duck, domesticated, meat and skin, cooked, roasted
Top nutrition facts for Duck meat

| Calories ⓘ Calories for selected serving | 1287 kcal |
|
Glycemic index ⓘ
Source: The food is assumed to have 0 or no glycemic index bason on the fact that it has no carbs and that foods with 0 carbs have no glycemic index
Check out our Glycemic index chart page for the full list.
|
0 (low) |
| Net Carbs ⓘ Net Carbs = Total Carbohydrates – Fiber – Sugar Alcohols | 0 grams |
| Default serving size ⓘ Serving sizes are mostly taken from FDA's Reference Amounts Customarily Consumed (RACCs) | 1 cup, chopped or diced (140 grams) |
| Acidity (Based on PRAL) ⓘ PRAL (Potential renal acid load) is calculated using a formula. On the PRAL scale the higher the positive value, the more is the acidifying effect on the body. The lower the negative value, the higher the alkalinity of the food. 0 is neutral. | 10.2 (acidic) |
| Oxalates ⓘ Animal products do not contain oxalate. | 0 mg |
Fats ⓘHigher in Fats content than 92% of foods
Saturated fat ⓘHigher in Saturated fat content than 87% of foods
Monounsaturated fat ⓘHigher in Monounsaturated fat content than 87% of foods
Cholesterol ⓘHigher in Cholesterol content than 81% of foods
Polyunsaturated fat ⓘHigher in Polyunsaturated fat content than 79% of foods
Duck meat calories (kcal)
| Calories for different serving sizes of duck meat | Calories | Weight |
|---|---|---|
| Calories in 100 grams | 337 | |
| Calories in 1 cup, chopped or diced | 472 | 140 g |
| Calories in 0.5 duck | 1287 | 382 g |
| Calories for different varieties of duck meat | Calories | Weight |
|---|---|---|
| Duck, domesticated, meat and skin, cooked, roasted (this food) | 337 | 100 g |
| Duck, scoter, white-winged, meat (Alaska Native) | 84 | 100 g |
Duck meat Glycemic index (GI)
Source:
The food is assumed to have 0 or no glycemic index bason on the fact that it has no carbs and that foods with 0 carbs have no glycemic index
Check out our Glycemic index chart page for the full list.
Mineral coverage chart
Mineral chart - relative view
Vitamin coverage chart
Vitamin A:
722µg of 900µg
80%
Vitamin E:
8mg of 15mg
53%
Vitamin D:
1.1µg of 20µg
5.7%
Vitamin C:
0mg of 90mg
0%
Vitamin B1:
2mg of 1mg
166%
Vitamin B2:
3.1mg of 1mg
237%
Vitamin B3:
55mg of 16mg
346%
Vitamin B5:
13mg of 5mg
252%
Vitamin B6:
2.1mg of 1mg
159%
Folate:
69µg of 400µg
17%
Vitamin B12:
3.4µg of 2µg
143%
Choline:
578mg of 550mg
105%
Vitamin K:
58µg of 120µg
49%
Vitamin chart - relative view
Macronutrients chart
Protein:
Daily Value: 145%
72.5 g of 50 g
72.5 g (145% of DV )
Fats:
Daily Value: 167%
108.3 g of 65 g
108.3 g (167% of DV )
Carbs:
Daily Value: 0%
0 g of 300 g
0 g (0% of DV )
Water:
Daily Value: 10%
198 g of 2,000 g
198 g (10% of DV )
Other:
3.1 g
3.1 g
Protein quality breakdown
Tryptophan:
2659mg of 280mg
950%
Threonine:
8859mg of 1,050mg
844%
Isoleucine:
9993mg of 1,400mg
714%
Leucine:
16789mg of 2,730mg
615%
Lysine:
17030mg of 2,100mg
811%
Methionine:
5444mg of 1,050mg
518%
Phenylalanine:
8618mg of 1,750mg
492%
Valine:
10749mg of 1,820mg
591%
Histidine:
5295mg of 700mg
756%
Fat type information
Saturated fat:
37 g
Monounsaturated fat:
49 g
Polyunsaturated fat:
14 g
All nutrients for Duck meat per selected serving size (0.5 duck - 382g)
| Nutrient | Value | DV% | In TOP % of foods | Comparison |
| Vitamin A | 241µg | 27% | 32% | |
| Calories | 1287kcal | 64% | 25% |
7.2 times more than Orange
|
| Protein | 73g | 173% | 27% |
6.7 times more than Broccoli
|
| Fats | 108g | 167% | 8% |
1.2 times less than Cheese
|
| Vitamin C | 0mg | 0% | 100% |
N/A
|
| Net carbs | 0g | N/A | 75% |
N/A
|
| Carbs | 0g | 0% | 100% |
N/A
|
| Cholesterol | 321mg | 107% | 19% |
4.4 times less than Egg
|
| Vitamin D | 0.38µg | 4% | 60% |
22 times less than Egg
|
| Magnesium | 61mg | 15% | 71% |
8.8 times less than Almonds
|
| Calcium | 42mg | 4% | 74% |
11.4 times less than Milk
|
| Potassium | 779mg | 23% | 58% |
1.4 times more than Cucumber
|
| Iron | 10mg | 129% | 25% |
Equal to Beef broiled
|
| Sugar | 0g | N/A | 100% |
N/A
|
| Fiber | 0g | 0% | 100% |
N/A
|
| Copper | 0.87mg | 96% | 29% |
1.6 times more than Shiitake
|
| Zinc | 7.1mg | 65% | 41% |
3.4 times less than Beef broiled
|
| Phosphorus | 596mg | 85% | 51% |
1.2 times less than Chicken meat
|
| Sodium | 225mg | 10% | 65% |
8.3 times less than White bread
|
| Vitamin E | 2.7mg | 18% | 51% |
2.1 times less than Kiwi
|
| Manganese | 0.07mg | 3% | 78% | |
| Selenium | 76µg | 139% | 46% | |
| Vitamin B1 | 0.66mg | 55% | 37% |
1.5 times less than Pea raw
|
| Vitamin B2 | 1mg | 79% | 31% |
2.1 times more than Avocado
|
| Vitamin B3 | 18mg | 115% | 34% |
2 times less than Turkey meat
|
| Vitamin B5 | 4.2mg | 84% | 34% |
Equal to Sunflower seeds
|
| Vitamin B6 | 0.69mg | 53% | 51% |
1.5 times more than Oats
|
| Vitamin B12 | 1.1µg | 48% | 55% |
2.3 times less than Pork
|
| Vitamin K | 19µg | 16% | 56% |
19.9 times less than Broccoli
|
| Folate | 23µg | 6% | 76% |
10.2 times less than Brussels sprouts
|
| Saturated fat | 37g | 185% | 13% |
1.6 times more than Beef broiled
|
| Choline | 193mg | 35% | 65% | |
| Monounsaturated fat | 49g | N/A | 13% |
1.3 times more than Avocado
|
| Polyunsaturated fat | 14g | N/A | 21% |
12.9 times less than Walnut
|
| Tryptophan | 0.89mg | 0% | 59% |
1.3 times less than Chicken meat
|
| Threonine | 3mg | 0% | 66% |
1.1 times more than Beef broiled
|
| Isoleucine | 3.3mg | 0% | 64% |
Equal to Salmon raw
|
| Leucine | 5.6mg | 0% | 66% |
1.7 times less than Tuna Bluefin
|
| Lysine | 5.7mg | 0% | 66% |
3.3 times more than Tofu
|
| Methionine | 1.8mg | 0% | 66% |
4.9 times more than Quinoa
|
| Phenylalanine | 2.9mg | 0% | 67% |
1.1 times more than Egg
|
| Valine | 3.6mg | 0% | 65% |
2.2 times less than Soybean raw
|
| Histidine | 1.8mg | 0% | 69% |
1.6 times less than Turkey meat
|
| Caffeine | 0mg | 0% | 100% | |
| Omega-3 - EPA | 0g | N/A | 100% |
N/A
|
| Omega-3 - DHA | 0g | N/A | 100% |
N/A
|
| Omega-3 - DPA | 0g | N/A | 100% |
N/A
|
Check out similar food or compare with current
NUTRITION FACTS LABEL
Nutrition Facts
___servings per container
Serving Size ______________
Serving Size ______________
Amount Per 100g
Calories 1287
% Daily Value*
167%
Total Fat
108g
168%
Saturated Fat 37g
0
Trans Fat
0g
107%
Cholesterol 321mg
9.8%
Sodium 225mg
0
Total Carbohydrate
0g
0
Dietary Fiber
0g
Total Sugars 0g
Includes ? g Added Sugars
Protein
73g
Vitamin D
11mcg
1.4%
Calcium
42mg
4.2%
Iron
10mg
129%
Potassium
779mg
23%
*
The % Daily Value (DV) tells you how much a nutrient in a serving of food contributes to a daily diet. 2,000 calories a day is used for general nutrition advice.
Health checks
ⓘ
Dietary cholesterol is not associated with an increased risk of coronary heart disease in healthy individuals. However, dietary cholesterol is common in foods that are high in harmful saturated fats.
Source
Low in Cholesterol
ⓘ
Trans fat consumption increases the risk of cardiovascular disease and mortality by negatively affecting blood lipid levels.
Source
No Trans Fats
ⓘ
Saturated fat intake can raise total cholesterol and LDL (low-density lipoprotein) levels, leading to an increased risk of atherosclerosis. Dietary guidelines recommend limiting saturated fats to under 10% of calories a day.
Source
Low in Saturated Fats
ⓘ
While the consumption of moderate amounts of added sugars is not detrimental to health, an excessive intake can increase the risk of obesity, and therefore, diabetes.
Source
Low in Sugars
Duck meat nutrition infographic
Infographic link
References
All the values for which the sources are not specified explicitly are taken from FDA’s Food Central. The exact link to the food presented on this page can be found below.