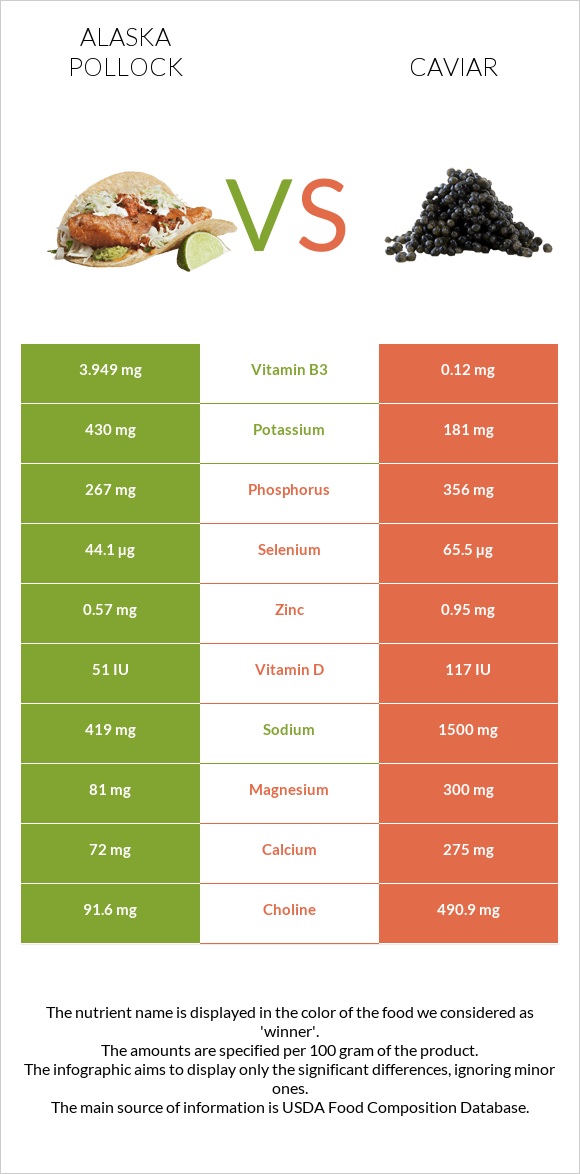
How are pollock and caviar different? Pollock is higher in vitamin B3; however, caviar is richer in vitamin B12, iron, choline, vitamin B5, magnesium, selenium, and vitamin B2. Daily need coverage for vitamin B12 for caviar is 681% higher. Pollock contains 33 times more vitamin B3 than caviar. While pollock contains 3.949mg of vitamin B3, caviar contains only 0.12mg. Pollock has less sodium. Fish, pollock, Alaska, cooked, dry heat (may have been previously frozen) and Fish, caviar, black, and red, granular are the varieties used in this article.
Infographic
Mineral Comparison
Mineral comparison score is based on the number of minerals by which one or the other food is richer. The "coverage" charts below show how much of the daily needs can be covered by 300 grams of the food.
2
100 g
300 g
1 fillet - 60g 3 oz - 85g
Magnesium
Magnesium
Calcium
Calcium
Potassium
Potassium
Iron
Iron
Copper
Copper
Zinc
Zinc
Phosphorus
Phosphorus
Sodium
Sodium
Manganese
Manganese
Selenium
Selenium
58%
22%
38%
21%
20%
16%
114%
55%
2.3%
241%
8
100 g
300 g
1 tbsp - 16g 1 oz - 28.35g
Magnesium
Magnesium
Calcium
Calcium
Potassium
Potassium
Iron
Iron
Copper
Copper
Zinc
Zinc
Phosphorus
Phosphorus
Sodium
Sodium
Manganese
Manganese
Selenium
Selenium
214%
83%
16%
446%
37%
26%
153%
196%
6.5%
357%
Vitamin Comparison
Vitamin comparison score is based on the number of vitamins by which one or the other food is richer. The "coverage" charts below show how much of the daily needs can be covered by 300 grams of the food.
1
100 g
300 g
1 fillet - 60g 3 oz - 85g
Vitamin C
Vit. C
Vitamin D
Vit. D
Vitamin A
Vit. A
Vitamin E
Vit. E
Vitamin B1
Vit. B1
Vitamin B2
Vit. B2
Vitamin B3
Vit. B3
Vitamin B5
Vit. B5
Vitamin B6
Vit. B6
Vitamin B12
Vit. B12
Vitamin K
Vit. K
Folate
Folate
0%
20%
5.7%
5.6%
14%
51%
74%
26%
76%
458%
0.25%
2.3%
9
100 g
300 g
1 tbsp - 16g 1 oz - 28.35g
Vitamin C
Vit. C
Vitamin D
Vit. D
Vitamin A
Vit. A
Vitamin E
Vit. E
Vitamin B1
Vit. B1
Vitamin B2
Vit. B2
Vitamin B3
Vit. B3
Vitamin B5
Vit. B5
Vitamin B6
Vit. B6
Vitamin B12
Vit. B12
Vitamin K
Vit. K
Folate
Folate
0%
44%
90%
38%
48%
143%
2.3%
210%
74%
2500%
1.5%
38%
All nutrients comparison - raw data values
Nutrient
DV% diff.
Vitamin B12
3.66µg
20µg
681%
Cholesterol
86mg
588mg
167%
Iron
0.56mg
11.88mg
142%
Choline
91.6mg
490.9mg
73%
Vitamin B5
0.432mg
3.5mg
61%
Magnesium
81mg
300mg
52%
Sodium
419mg
1500mg
47%
Polyunsaturated fat
0.583g
7.405g
45%
Selenium
44.1µg
65.5µg
39%
Vitamin B2
0.223mg
0.62mg
31%
Vitamin A
17µg
271µg
28%
Fats
1.18g
17.9g
26%
Vitamin B3
3.949mg
0.12mg
24%
Calcium
72mg
275mg
20%
Saturated fat
0.159g
4.06g
18%
Phosphorus
267mg
356mg
13%
Folate
3µg
50µg
12%
Vitamin E
0.28mg
1.89mg
11%
Vitamin B1
0.054mg
0.19mg
11%
Monounsaturated fat
0.134g
4.631g
11%
Calories
111kcal
264kcal
8%
Vitamin D*
51 IU
117 IU
8%
Vitamin D
1.3µg
2.9µg
8%
Potassium
430mg
181mg
7%
Copper
0.06mg
0.11mg
6%
Zinc
0.57mg
0.95mg
3%
Protein
23.48g
24.6g
2%
Carbs
0g
4g
1%
Manganese
0.018mg
0.05mg
1%
Vitamin B6
0.329mg
0.32mg
1%
Protein per 100 calories
21g
9.3g
N/A
Calories per 10 g protein
47kcal
107kcal
N/A
Weight per 100 calories
90g
38g
N/A
Unsaturated / Saturated Fat ratio
4.5
3
N/A
Net carbs
0g
4g
N/A
Vitamin K
0.1µg
0.6µg
0%
Tryptophan
0.263mg
0.323mg
0%
Threonine
1.029mg
1.263mg
0%
Isoleucine
1.082mg
1.035mg
0%
Leucine
1.908mg
2.133mg
0%
Lysine
2.157mg
1.834mg
0%
Methionine
0.696mg
0.646mg
0%
Phenylalanine
0.917mg
1.071mg
0%
Valine
1.21mg
1.263mg
0%
Histidine
0.691mg
0.649mg
0%
Omega-3 - EPA
0.086g
2.741g
N/A
Omega-3 - DHA
0.423g
3.8g
N/A
Omega-3 - DPA
0.027g
0.229g
N/A
Macronutrient Comparison
Macronutrient breakdown side-by-side comparison
1
23%
74%
2%
Protein:
23.48 g
Fats:
1.18 g
Carbs:
0 g
Water:
73.65 g
Other:
1.69 g
4
25%
18%
4%
48%
6%
Protein:
24.6 g
Fats:
17.9 g
Carbs:
4 g
Water:
47.5 g
Other:
6 g
Contains
more
Water Water
+55.1%
Contains
more
Fats Fats
+1416.9%
Contains
more
Carbs Carbs
+∞%
Contains
more
Other Other
+255%
Fat Type Comparison
Fat type breakdown side-by-side comparison
1
18%
15%
67%
Saturated fat:
Sat. Fat
0.159 g
Monounsaturated fat:
Mono. Fat
0.134 g
Polyunsaturated fat:
Poly. Fat
0.583 g
2
25%
29%
46%
Saturated fat:
Sat. Fat
4.06 g
Monounsaturated fat:
Mono. Fat
4.631 g
Polyunsaturated fat:
Poly. Fat
7.405 g
Contains
less
Sat. Fat Saturated fat
-96.1%
Contains
more
Mono. Fat Monounsaturated fat
+3356%
Contains
more
Poly. Fat Polyunsaturated fat
+1170.2%