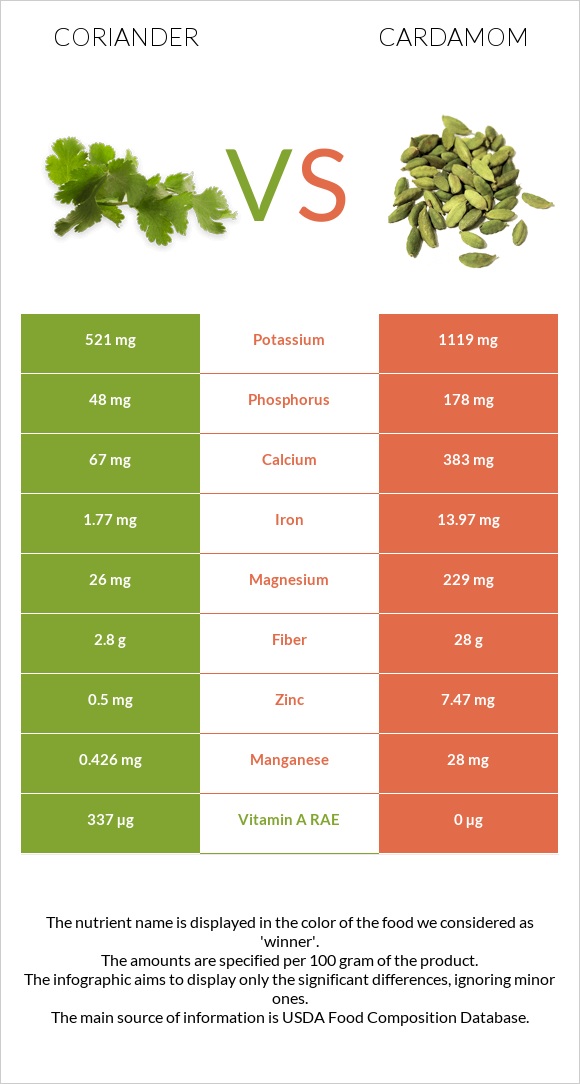
Differences between coriander and cardamom Coriander has more vitamin A, while cardamom has more manganese, iron, fiber, zinc, magnesium, calcium, phosphorus, potassium, and copper. Cardamom's daily need coverage for manganese is 1199% higher. Cardamom has a lower glycemic index. The glycemic index of cardamom is 0, while the glycemic index of coriander is 32. The food types used in this comparison are Coriander (cilantro) leaves, raw and Spices, cardamom .
Infographic
Mineral Comparison
Mineral comparison score is based on the number of minerals by which one or the other food is richer. The "coverage" charts below show how much of the daily needs can be covered by 300 grams of the food.
1
100 g
300 g
0.25 cup - 4g 9 sprigs - 20g
Magnesium
Magnesium
Calcium
Calcium
Potassium
Potassium
Iron
Iron
Copper
Copper
Zinc
Zinc
Phosphorus
Phosphorus
Sodium
Sodium
Manganese
Manganese
Selenium
Selenium
19%
20%
46%
66%
75%
14%
21%
6%
56%
4.9%
9
100 g
300 g
1 tsp, ground - 2g 1 tbsp, ground - 5.8g
Magnesium
Magnesium
Calcium
Calcium
Potassium
Potassium
Iron
Iron
Copper
Copper
Zinc
Zinc
Phosphorus
Phosphorus
Sodium
Sodium
Manganese
Manganese
Selenium
Selenium
164%
115%
99%
524%
128%
204%
76%
2.3%
3652%
0%
Vitamin Comparison
Vitamin comparison score is based on the number of vitamins by which one or the other food is richer. The "coverage" charts below show how much of the daily needs can be covered by 300 grams of the food.
6
100 g
300 g
0.25 cup - 4g 9 sprigs - 20g
Vitamin C
Vit. C
Vitamin D
Vit. D
Vitamin A
Vit. A
Vitamin E
Vit. E
Vitamin B1
Vit. B1
Vitamin B2
Vit. B2
Vitamin B3
Vit. B3
Vitamin B5
Vit. B5
Vitamin B6
Vit. B6
Vitamin B12
Vit. B12
Vitamin K
Vit. K
Folate
Folate
90%
0%
112%
50%
17%
37%
21%
34%
34%
0%
775%
47%
3
100 g
300 g
1 tsp, ground - 2g 1 tbsp, ground - 5.8g
Vitamin C
Vit. C
Vitamin D
Vit. D
Vitamin A
Vit. A
Vitamin E
Vit. E
Vitamin B1
Vit. B1
Vitamin B2
Vit. B2
Vitamin B3
Vit. B3
Vitamin B5
Vit. B5
Vitamin B6
Vit. B6
Vitamin B12
Vit. B12
Vitamin K
Vit. K
Folate
Folate
70%
0%
0%
0%
50%
42%
21%
0%
53%
0%
0%
0%
All nutrients comparison - raw data values
Nutrient
DV% diff.
Manganese
0.426mg
28mg
1199%
Vitamin K
310µg
258%
Iron
1.77mg
13.97mg
153%
Fiber
2.8g
28g
101%
Zinc
0.5mg
7.47mg
63%
Magnesium
26mg
229mg
48%
Vitamin A
337µg
0µg
37%
Calcium
67mg
383mg
32%
Carbs
3.67g
68.47g
22%
Phosphorus
48mg
178mg
19%
Potassium
521mg
1119mg
18%
Copper
0.225mg
0.383mg
18%
Protein
2.13g
10.76g
17%
Vitamin E
2.5mg
17%
Folate
62µg
16%
Calories
23kcal
311kcal
14%
Vitamin B1
0.067mg
0.198mg
11%
Vitamin B5
0.57mg
11%
Fats
0.52g
6.7g
10%
Vitamin C
27mg
21mg
7%
Vitamin B6
0.149mg
0.23mg
6%
Saturated fat
0.014g
0.68g
3%
Polyunsaturated fat
0.04g
0.43g
3%
Selenium
0.9µg
2%
Vitamin B2
0.162mg
0.182mg
2%
Choline
12.8mg
2%
Sodium
46mg
18mg
1%
Monounsaturated fat
0.275g
0.87g
1%
Protein per 100 calories
9.3g
3.5g
N/A
Calories per 10 g protein
108kcal
289kcal
N/A
Weight per 100 calories
435g
32g
N/A
Unsaturated / Saturated Fat ratio
23
1.9
N/A
Net carbs
0.87g
40.47g
N/A
Sugar
0.87g
N/A
Vitamin B3
1.114mg
1.102mg
0%
Macronutrient Comparison
Macronutrient breakdown side-by-side comparison
1
2%
4%
92%
Protein:
2.13 g
Fats:
0.52 g
Carbs:
3.67 g
Water:
92.21 g
Other:
1.47 g
4
11%
7%
68%
8%
6%
Protein:
10.76 g
Fats:
6.7 g
Carbs:
68.47 g
Water:
8.28 g
Other:
5.79 g
Contains
more
Water Water
+1013.6%
Contains
more
Protein Protein
+405.2%
Contains
more
Fats Fats
+1188.5%
Contains
more
Carbs Carbs
+1765.7%
Contains
more
Other Other
+293.9%
Fat Type Comparison
Fat type breakdown side-by-side comparison
1
4%
84%
12%
Saturated fat:
Sat. Fat
0.014 g
Monounsaturated fat:
Mono. Fat
0.275 g
Polyunsaturated fat:
Poly. Fat
0.04 g
2
34%
44%
22%
Saturated fat:
Sat. Fat
0.68 g
Monounsaturated fat:
Mono. Fat
0.87 g
Polyunsaturated fat:
Poly. Fat
0.43 g
Contains
less
Sat. Fat Saturated fat
-97.9%
Contains
more
Mono. Fat Monounsaturated fat
+216.4%
Contains
more
Poly. Fat Polyunsaturated fat
+975%