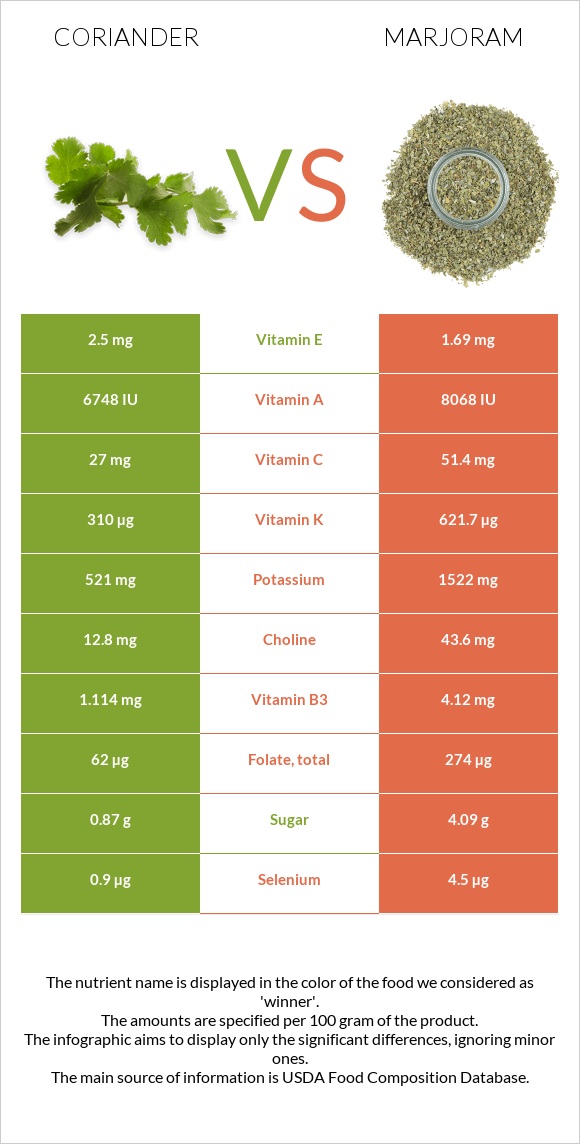
How are coriander and marjoram different? Marjoram is higher than coriander in iron, vitamin K, manganese, calcium, fiber, copper, vitamin B6, magnesium, folate, and phosphorus. Marjoram covers your daily need for iron, 1012% more than coriander. Coriander (cilantro) leaves, raw and Spices, marjoram, dried types were used in this article.
Infographic
Mineral Comparison
Mineral comparison score is based on the number of minerals by which one or the other food is richer. The "coverage" charts below show how much of the daily needs can be covered by 300 grams of the food.
1
100 g
300 g
0.25 cup - 4g 9 sprigs - 20g
Magnesium
Magnesium
Calcium
Calcium
Potassium
Potassium
Iron
Iron
Copper
Copper
Zinc
Zinc
Phosphorus
Phosphorus
Sodium
Sodium
Manganese
Manganese
Selenium
Selenium
19%
20%
46%
66%
75%
14%
21%
6%
56%
4.9%
9
100 g
300 g
1 tsp - 0.6g 1 tbsp - 1.7g
Magnesium
Magnesium
Calcium
Calcium
Potassium
Potassium
Iron
Iron
Copper
Copper
Zinc
Zinc
Phosphorus
Phosphorus
Sodium
Sodium
Manganese
Manganese
Selenium
Selenium
247%
597%
134%
3102%
378%
98%
131%
10%
709%
25%
Vitamin Comparison
Vitamin comparison score is based on the number of vitamins by which one or the other food is richer. The "coverage" charts below show how much of the daily needs can be covered by 300 grams of the food.
2
100 g
300 g
0.25 cup - 4g 9 sprigs - 20g
Vitamin C
Vit. C
Vitamin D
Vit. D
Vitamin A
Vit. A
Vitamin E
Vit. E
Vitamin B1
Vit. B1
Vitamin B2
Vit. B2
Vitamin B3
Vit. B3
Vitamin B5
Vit. B5
Vitamin B6
Vit. B6
Vitamin B12
Vit. B12
Vitamin K
Vit. K
Folate
Folate
90%
0%
112%
50%
17%
37%
21%
34%
34%
0%
775%
47%
8
100 g
300 g
1 tsp - 0.6g 1 tbsp - 1.7g
Vitamin C
Vit. C
Vitamin D
Vit. D
Vitamin A
Vit. A
Vitamin E
Vit. E
Vitamin B1
Vit. B1
Vitamin B2
Vit. B2
Vitamin B3
Vit. B3
Vitamin B5
Vit. B5
Vitamin B6
Vit. B6
Vitamin B12
Vit. B12
Vitamin K
Vit. K
Folate
Folate
171%
0%
134%
34%
72%
73%
77%
0%
275%
0%
1554%
206%
All nutrients comparison - raw data values
Nutrient
DV% diff.
Iron
1.77mg
82.71mg
1012%
Vitamin K
310µg
621.7µg
260%
Manganese
0.426mg
5.433mg
218%
Calcium
67mg
1990mg
192%
Fiber
2.8g
40.3g
150%
Copper
0.225mg
1.133mg
101%
Vitamin B6
0.149mg
1.19mg
80%
Magnesium
26mg
346mg
76%
Folate
62µg
274µg
53%
Phosphorus
48mg
306mg
37%
Potassium
521mg
1522mg
29%
Polyunsaturated fat
0.04g
4.405g
29%
Zinc
0.5mg
3.6mg
28%
Vitamin C
27mg
51.4mg
27%
Protein
2.13g
12.66g
21%
Carbs
3.67g
60.56g
19%
Vitamin B1
0.067mg
0.289mg
19%
Vitamin B3
1.114mg
4.12mg
19%
Calories
23kcal
271kcal
12%
Vitamin B2
0.162mg
0.316mg
12%
Vitamin B5
0.57mg
11%
Fats
0.52g
7.04g
10%
Vitamin A
337µg
403µg
7%
Selenium
0.9µg
4.5µg
7%
Choline
12.8mg
43.6mg
6%
Vitamin E
2.5mg
1.69mg
5%
Saturated fat
0.014g
0.529g
2%
Monounsaturated fat
0.275g
0.94g
2%
Sodium
46mg
77mg
1%
Protein per 100 calories
9.3g
4.7g
N/A
Calories per 10 g protein
108kcal
214kcal
N/A
Weight per 100 calories
435g
37g
N/A
Unsaturated / Saturated Fat ratio
23
10
N/A
Net carbs
0.87g
20.26g
N/A
Sugar
0.87g
4.09g
N/A
Macronutrient Comparison
Macronutrient breakdown side-by-side comparison
1
2%
4%
92%
Protein:
2.13 g
Fats:
0.52 g
Carbs:
3.67 g
Water:
92.21 g
Other:
1.47 g
4
13%
7%
61%
8%
12%
Protein:
12.66 g
Fats:
7.04 g
Carbs:
60.56 g
Water:
7.64 g
Other:
12.1 g
Contains
more
Water Water
+1106.9%
Contains
more
Protein Protein
+494.4%
Contains
more
Fats Fats
+1253.8%
Contains
more
Carbs Carbs
+1550.1%
Contains
more
Other Other
+723.1%
Fat Type Comparison
Fat type breakdown side-by-side comparison
1
4%
84%
12%
Saturated fat:
Sat. Fat
0.014 g
Monounsaturated fat:
Mono. Fat
0.275 g
Polyunsaturated fat:
Poly. Fat
0.04 g
2
9%
16%
75%
Saturated fat:
Sat. Fat
0.529 g
Monounsaturated fat:
Mono. Fat
0.94 g
Polyunsaturated fat:
Poly. Fat
4.405 g
Contains
less
Sat. Fat Saturated fat
-97.4%
Contains
more
Mono. Fat Monounsaturated fat
+241.8%
Contains
more
Poly. Fat Polyunsaturated fat
+10912.5%