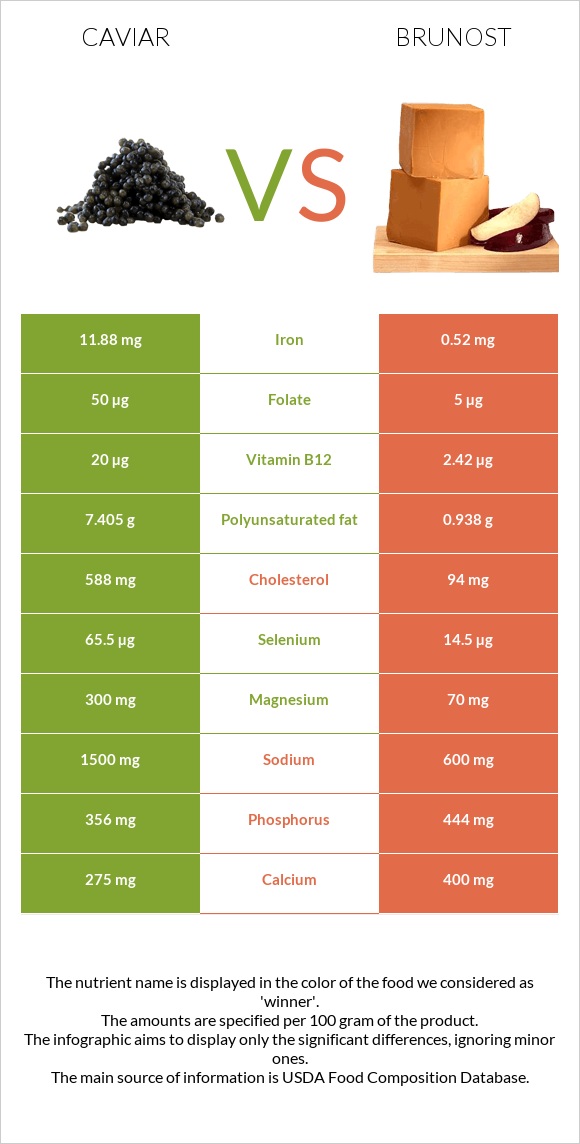
Summary of differences between caviar and brunost Caviar has more vitamin B12, iron, selenium, and magnesium, while brunost has more vitamin B2, potassium, and phosphorus. Caviar covers your daily need for vitamin B12, 733% more than brunost. Caviar contains 23 times more iron than brunost. While caviar contains 11.88mg of iron, brunost contains only 0.52mg. The amount of cholesterol in brunost is lower. Caviar has a lower glycemic index. The glycemic index of caviar is 0, while the glycemic index of brunost is 27. These are the specific foods used in this comparison Fish, caviar, black, and red, granular and Cheese, gjetost .
Infographic
Mineral Comparison
Mineral comparison score is based on the number of minerals by which one or the other food is richer. The "coverage" charts below show how much of the daily needs can be covered by 300 grams of the food.
5
100 g
300 g
1 tbsp - 16g 1 oz - 28.35g
Magnesium
Magnesium
Calcium
Calcium
Potassium
Potassium
Iron
Iron
Copper
Copper
Zinc
Zinc
Phosphorus
Phosphorus
Sodium
Sodium
Manganese
Manganese
Selenium
Selenium
214%
83%
16%
446%
37%
26%
153%
196%
6.5%
357%
5
100 g
300 g
1 oz - 28.35g 1 package (8 oz) - 227g
Magnesium
Magnesium
Calcium
Calcium
Potassium
Potassium
Iron
Iron
Copper
Copper
Zinc
Zinc
Phosphorus
Phosphorus
Sodium
Sodium
Manganese
Manganese
Selenium
Selenium
50%
120%
124%
20%
27%
31%
190%
78%
5.2%
79%
Vitamin Comparison
Vitamin comparison score is based on the number of vitamins by which one or the other food is richer. The "coverage" charts below show how much of the daily needs can be covered by 300 grams of the food.
6
100 g
300 g
1 tbsp - 16g 1 oz - 28.35g
Vitamin C
Vit. C
Vitamin D
Vit. D
Vitamin A
Vit. A
Vitamin E
Vit. E
Vitamin B1
Vit. B1
Vitamin B2
Vit. B2
Vitamin B3
Vit. B3
Vitamin B5
Vit. B5
Vitamin B6
Vit. B6
Vitamin B12
Vit. B12
Vitamin K
Vit. K
Folate
Folate
0%
44%
90%
38%
48%
143%
2.3%
210%
74%
2500%
1.5%
38%
4
100 g
300 g
1 oz - 28.35g 1 package (8 oz) - 227g
Vitamin C
Vit. C
Vitamin D
Vit. D
Vitamin A
Vit. A
Vitamin E
Vit. E
Vitamin B1
Vit. B1
Vitamin B2
Vit. B2
Vitamin B3
Vit. B3
Vitamin B5
Vit. B5
Vitamin B6
Vit. B6
Vitamin B12
Vit. B12
Vitamin K
Vit. K
Folate
Folate
0%
0%
111%
0%
79%
319%
15%
201%
63%
303%
0%
3.8%
All nutrients comparison - raw data values
Nutrient
DV% diff.
Vitamin B12
20µg
2.42µg
733%
Cholesterol
588mg
94mg
165%
Iron
11.88mg
0.52mg
142%
Selenium
65.5µg
14.5µg
93%
Choline
490.9mg
89%
Saturated fat
4.06g
19.16g
69%
Vitamin B2
0.62mg
1.382mg
59%
Magnesium
300mg
70mg
55%
Polyunsaturated fat
7.405g
0.938g
43%
Sodium
1500mg
600mg
39%
Potassium
181mg
1409mg
36%
Protein
24.6g
9.65g
30%
Fats
17.9g
29.51g
18%
Vitamin D*
117 IU
15%
Vitamin D
2.9µg
15%
Carbs
4g
42.65g
13%
Calcium
275mg
400mg
13%
Phosphorus
356mg
444mg
13%
Vitamin E
1.89mg
13%
Folate
50µg
5µg
11%
Calories
264kcal
466kcal
10%
Vitamin B1
0.19mg
0.315mg
10%
Monounsaturated fat
4.631g
7.879g
8%
Vitamin A
271µg
334µg
7%
Vitamin B3
0.12mg
0.813mg
4%
Vitamin B6
0.32mg
0.271mg
4%
Copper
0.11mg
0.08mg
3%
Vitamin B5
3.5mg
3.351mg
3%
Zinc
0.95mg
1.14mg
2%
Vitamin K
0.6µg
1%
Protein per 100 calories
9.3g
2.1g
N/A
Calories per 10 g protein
107kcal
483kcal
N/A
Weight per 100 calories
38g
21g
N/A
Unsaturated / Saturated Fat ratio
3
0.46
N/A
Net carbs
4g
42.65g
N/A
Manganese
0.05mg
0.04mg
0%
Tryptophan
0.323mg
0.135mg
0%
Threonine
1.263mg
0.393mg
0%
Isoleucine
1.035mg
0.519mg
0%
Leucine
2.133mg
0.992mg
0%
Lysine
1.834mg
0.814mg
0%
Methionine
0.646mg
0.318mg
0%
Phenylalanine
1.071mg
0.54mg
0%
Valine
1.263mg
0.765mg
0%
Histidine
0.649mg
0.293mg
0%
Omega-3 - EPA
2.741g
N/A
Omega-3 - DHA
3.8g
N/A
Omega-3 - DPA
0.229g
N/A
Macronutrient Comparison
Macronutrient breakdown side-by-side comparison
3
25%
18%
4%
48%
6%
Protein:
24.6 g
Fats:
17.9 g
Carbs:
4 g
Water:
47.5 g
Other:
6 g
2
10%
30%
43%
13%
5%
Protein:
9.65 g
Fats:
29.51 g
Carbs:
42.65 g
Water:
13.44 g
Other:
4.75 g
Contains
more
Protein Protein
+154.9%
Contains
more
Water Water
+253.4%
Contains
more
Other Other
+26.3%
Contains
more
Fats Fats
+64.9%
Contains
more
Carbs Carbs
+966.3%
Fat Type Comparison
Fat type breakdown side-by-side comparison
2
25%
29%
46%
Saturated fat:
Sat. Fat
4.06 g
Monounsaturated fat:
Mono. Fat
4.631 g
Polyunsaturated fat:
Poly. Fat
7.405 g
1
68%
28%
3%
Saturated fat:
Sat. Fat
19.16 g
Monounsaturated fat:
Mono. Fat
7.879 g
Polyunsaturated fat:
Poly. Fat
0.938 g
Contains
less
Sat. Fat Saturated fat
-78.8%
Contains
more
Poly. Fat Polyunsaturated fat
+689.4%
Contains
more
Mono. Fat Monounsaturated fat
+70.1%