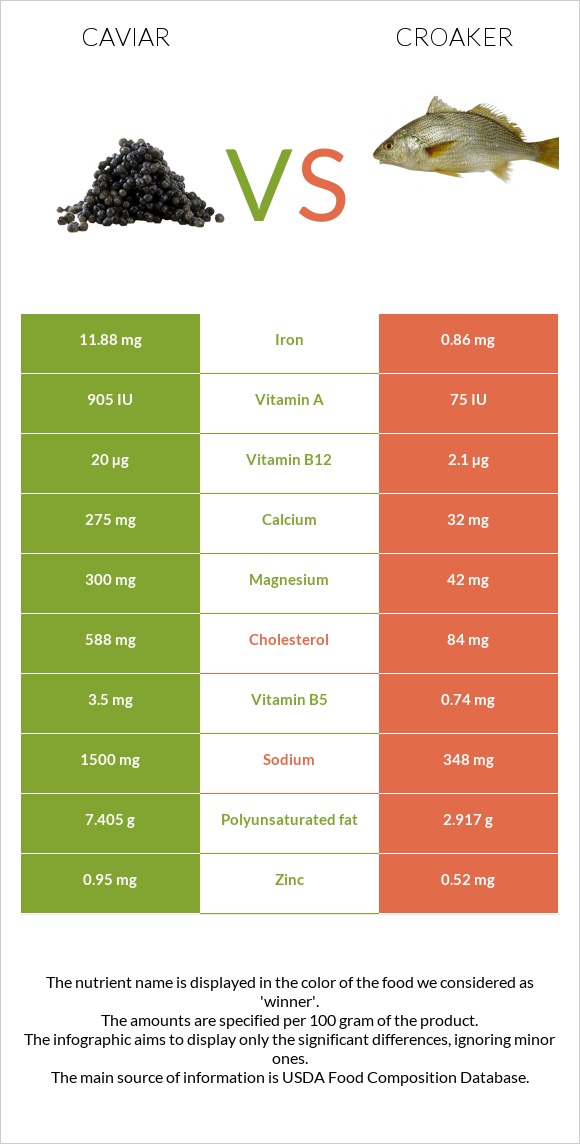
Summary of differences between caviar and croaker Caviar has more vitamin B12, iron, magnesium, vitamin B5, selenium, vitamin B2, and calcium, while croaker has more vitamin B3. Caviar covers your daily need for vitamin B12, 746% more than croaker. Caviar contains 14 times more iron than croaker. While caviar contains 11.88mg of iron, croaker contains only 0.86mg. The amount of cholesterol in croaker is lower. These are the specific foods used in this comparison Fish, caviar, black, and red, granular and Fish, croaker, Atlantic, cooked, breaded, and fried .
Infographic
Mineral Comparison
Mineral comparison score is based on the number of minerals by which one or the other food is richer. The "coverage" charts below show how much of the daily needs can be covered by 300 grams of the food.
7
100 g
300 g
1 tbsp - 16g 1 oz - 28.35g
Magnesium
Magnesium
Calcium
Calcium
Potassium
Potassium
Iron
Iron
Copper
Copper
Zinc
Zinc
Phosphorus
Phosphorus
Sodium
Sodium
Manganese
Manganese
Selenium
Selenium
214%
83%
16%
446%
37%
26%
153%
196%
6.5%
357%
3
100 g
300 g
3 oz - 85g 1 fillet - 87g
Magnesium
Magnesium
Calcium
Calcium
Potassium
Potassium
Iron
Iron
Copper
Copper
Zinc
Zinc
Phosphorus
Phosphorus
Sodium
Sodium
Manganese
Manganese
Selenium
Selenium
30%
9.6%
30%
32%
22%
14%
93%
45%
10%
212%
Vitamin Comparison
Vitamin comparison score is based on the number of vitamins by which one or the other food is richer. The "coverage" charts below show how much of the daily needs can be covered by 300 grams of the food.
10
100 g
300 g
1 tbsp - 16g 1 oz - 28.35g
Vitamin C
Vit. C
Vitamin D
Vit. D
Vitamin A
Vit. A
Vitamin E
Vit. E
Vitamin B1
Vit. B1
Vitamin B2
Vit. B2
Vitamin B3
Vit. B3
Vitamin B5
Vit. B5
Vitamin B6
Vit. B6
Vitamin B12
Vit. B12
Vitamin K
Vit. K
Folate
Folate
0%
44%
90%
38%
48%
143%
2.3%
210%
74%
2500%
1.5%
38%
1
100 g
300 g
3 oz - 85g 1 fillet - 87g
Vitamin C
Vit. C
Vitamin D
Vit. D
Vitamin A
Vit. A
Vitamin E
Vit. E
Vitamin B1
Vit. B1
Vitamin B2
Vit. B2
Vitamin B3
Vit. B3
Vitamin B5
Vit. B5
Vitamin B6
Vit. B6
Vitamin B12
Vit. B12
Vitamin K
Vit. K
Folate
Folate
0%
0%
7.7%
0%
23%
30%
81%
44%
60%
263%
0%
26%
All nutrients comparison - raw data values
Nutrient
DV% diff.
Vitamin B12
20µg
2.1µg
746%
Cholesterol
588mg
84mg
168%
Iron
11.88mg
0.86mg
138%
Choline
490.9mg
89%
Magnesium
300mg
42mg
61%
Vitamin B5
3.5mg
0.74mg
55%
Sodium
1500mg
348mg
50%
Selenium
65.5µg
38.8µg
49%
Vitamin B2
0.62mg
0.13mg
38%
Polyunsaturated fat
7.405g
2.917g
30%
Vitamin A
271µg
23µg
28%
Vitamin B3
0.12mg
4.3mg
26%
Calcium
275mg
32mg
24%
Phosphorus
356mg
217mg
20%
Vitamin D*
117 IU
15%
Vitamin D
2.9µg
15%
Protein
24.6g
18.2g
13%
Vitamin E
1.89mg
13%
Fats
17.9g
12.67g
8%
Vitamin B1
0.19mg
0.09mg
8%
Potassium
181mg
340mg
5%
Copper
0.11mg
0.065mg
5%
Vitamin B6
0.32mg
0.26mg
5%
Zinc
0.95mg
0.52mg
4%
Folate
50µg
34µg
4%
Saturated fat
4.06g
3.476g
3%
Calories
264kcal
221kcal
2%
Fiber
0g
0.4g
2%
Monounsaturated fat
4.631g
5.32g
2%
Carbs
4g
7.54g
1%
Manganese
0.05mg
0.08mg
1%
Vitamin K
0.6µg
1%
Protein per 100 calories
9.3g
8.2g
N/A
Calories per 10 g protein
107kcal
121kcal
N/A
Weight per 100 calories
38g
45g
N/A
Unsaturated / Saturated Fat ratio
3
2.4
N/A
Net carbs
4g
7.14g
N/A
Tryptophan
0.323mg
0.208mg
0%
Threonine
1.263mg
0.788mg
0%
Isoleucine
1.035mg
0.847mg
0%
Leucine
2.133mg
1.48mg
0%
Lysine
1.834mg
1.571mg
0%
Methionine
0.646mg
0.525mg
0%
Phenylalanine
1.071mg
0.742mg
0%
Valine
1.263mg
0.947mg
0%
Histidine
0.649mg
0.525mg
0%
Omega-3 - EPA
2.741g
0.113g
N/A
Omega-3 - DHA
3.8g
0.089g
N/A
Omega-3 - DPA
0.229g
0.079g
N/A
Macronutrient Comparison
Macronutrient breakdown side-by-side comparison
3
25%
18%
4%
48%
6%
Protein:
24.6 g
Fats:
17.9 g
Carbs:
4 g
Water:
47.5 g
Other:
6 g
2
18%
13%
8%
60%
2%
Protein:
18.2 g
Fats:
12.67 g
Carbs:
7.54 g
Water:
59.76 g
Other:
1.83 g
Contains
more
Protein Protein
+35.2%
Contains
more
Fats Fats
+41.3%
Contains
more
Other Other
+227.9%
Contains
more
Carbs Carbs
+88.5%
Contains
more
Water Water
+25.8%
Fat Type Comparison
Fat type breakdown side-by-side comparison
1
25%
29%
46%
Saturated fat:
Sat. Fat
4.06 g
Monounsaturated fat:
Mono. Fat
4.631 g
Polyunsaturated fat:
Poly. Fat
7.405 g
2
30%
45%
25%
Saturated fat:
Sat. Fat
3.476 g
Monounsaturated fat:
Mono. Fat
5.32 g
Polyunsaturated fat:
Poly. Fat
2.917 g
Contains
more
Poly. Fat Polyunsaturated fat
+153.9%
Contains
less
Sat. Fat Saturated fat
-14.4%
Contains
more
Mono. Fat Monounsaturated fat
+14.9%