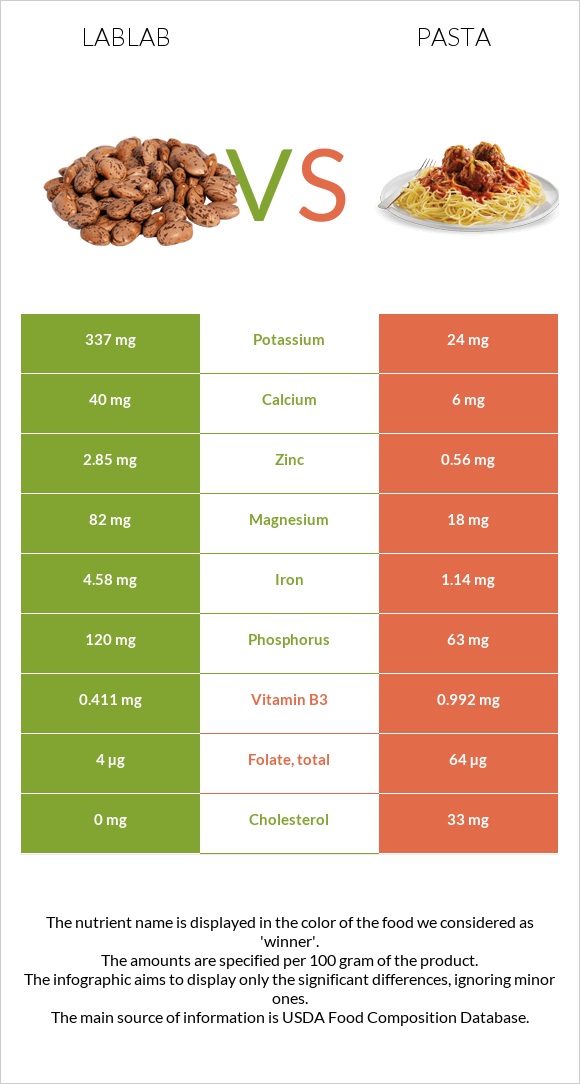
Important differences between lablab and pasta Lablab has more iron, copper, zinc, magnesium, manganese, potassium, and phosphorus; however, pasta has more folate and vitamin B2. Lablab's daily need coverage for iron is 43% more. Lablab has 14 times more potassium than pasta. Lablab has 337mg of potassium, while pasta has 24mg. The food varieties used in the comparison are Hyacinth beans, mature seeds, cooked, boiled, without salt and Pasta, fresh-refrigerated, plain, cooked .
Infographic
Mineral Comparison
Mineral comparison score is based on the number of minerals by which one or the other food is richer. The "coverage" charts below show how much of the daily needs can be covered by 300 grams of the food.
9
100 g
300 g
1 cup - 194g
Magnesium
Magnesium
Calcium
Calcium
Potassium
Potassium
Iron
Iron
Copper
Copper
Zinc
Zinc
Phosphorus
Phosphorus
Sodium
Sodium
Manganese
Manganese
Selenium
Selenium
59%
12%
30%
172%
114%
78%
51%
0.91%
63%
15%
1
100 g
300 g
2 oz - 128g
Magnesium
Magnesium
Calcium
Calcium
Potassium
Potassium
Iron
Iron
Copper
Copper
Zinc
Zinc
Phosphorus
Phosphorus
Sodium
Sodium
Manganese
Manganese
Selenium
Selenium
13%
1.8%
2.1%
43%
31%
15%
27%
0.78%
29%
0%
Vitamin Comparison
Vitamin comparison score is based on the number of vitamins by which one or the other food is richer. The "coverage" charts below show how much of the daily needs can be covered by 300 grams of the food.
2
100 g
300 g
1 cup - 194g
Vitamin C
Vit. C
Vitamin D
Vit. D
Vitamin A
Vit. A
Vitamin E
Vit. E
Vitamin B1
Vit. B1
Vitamin B2
Vit. B2
Vitamin B3
Vit. B3
Vitamin B5
Vit. B5
Vitamin B6
Vit. B6
Vitamin B12
Vit. B12
Vitamin K
Vit. K
Folate
Folate
0%
0%
0%
0%
68%
8.5%
7.7%
19%
8.5%
0%
0%
3%
5
100 g
300 g
2 oz - 128g
Vitamin C
Vit. C
Vitamin D
Vit. D
Vitamin A
Vit. A
Vitamin E
Vit. E
Vitamin B1
Vit. B1
Vitamin B2
Vit. B2
Vitamin B3
Vit. B3
Vitamin B5
Vit. B5
Vitamin B6
Vit. B6
Vitamin B12
Vit. B12
Vitamin K
Vit. K
Folate
Folate
0%
0%
2%
0%
52%
35%
19%
11%
7.8%
18%
0%
48%
All nutrients comparison - raw data values
Nutrient
DV% diff.
Iron
4.58mg
1.14mg
43%
Copper
0.341mg
0.093mg
28%
Zinc
2.85mg
0.56mg
21%
Magnesium
82mg
18mg
15%
Folate
4µg
64µg
15%
Cholesterol
0mg
33mg
11%
Manganese
0.482mg
0.224mg
11%
Potassium
337mg
24mg
9%
Vitamin B2
0.037mg
0.15mg
9%
Phosphorus
120mg
63mg
8%
Protein
8.14g
5.15g
6%
Vitamin B12
0µg
0.14µg
6%
Selenium
2.8µg
5%
Vitamin B1
0.27mg
0.209mg
5%
Vitamin B3
0.411mg
0.992mg
4%
Calcium
40mg
6mg
3%
Vitamin B5
0.316mg
0.183mg
3%
Calories
117kcal
131kcal
1%
Fats
0.58g
1.05g
1%
Carbs
20.69g
24.93g
1%
Vitamin A
0µg
6µg
1%
Polyunsaturated fat
0.245g
0.429g
1%
Protein per 100 calories
7g
3.9g
N/A
Calories per 10 g protein
144kcal
254kcal
N/A
Weight per 100 calories
85g
76g
N/A
Net carbs
20.69g
24.93g
N/A
Sodium
7mg
6mg
0%
Vitamin B6
0.037mg
0.034mg
0%
Saturated fat
0.099g
0.15g
0%
Monounsaturated fat
0.026g
0.124g
0%
Tryptophan
0.068mg
0.065mg
0%
Threonine
0.315mg
0.134mg
0%
Isoleucine
0.39mg
0.197mg
0%
Leucine
0.691mg
0.348mg
0%
Lysine
0.556mg
0.097mg
0%
Methionine
0.065mg
0.079mg
0%
Phenylalanine
0.41mg
0.247mg
0%
Valine
0.422mg
0.217mg
0%
Histidine
0.233mg
0.103mg
0%
Macronutrient Comparison
Macronutrient breakdown side-by-side comparison
3
8%
21%
69%
Protein:
8.14 g
Fats:
0.58 g
Carbs:
20.69 g
Water:
69.13 g
Other:
1.46 g
2
5%
25%
69%
Protein:
5.15 g
Fats:
1.05 g
Carbs:
24.93 g
Water:
68.56 g
Other:
0.31 g
Contains
more
Protein Protein
+58.1%
Contains
more
Other Other
+371%
Contains
more
Fats Fats
+81%
Contains
more
Carbs Carbs
+20.5%
Fat Type Comparison
Fat type breakdown side-by-side comparison
1
27%
7%
66%
Saturated fat:
Sat. Fat
0.099 g
Monounsaturated fat:
Mono. Fat
0.026 g
Polyunsaturated fat:
Poly. Fat
0.245 g
2
21%
18%
61%
Saturated fat:
Sat. Fat
0.15 g
Monounsaturated fat:
Mono. Fat
0.124 g
Polyunsaturated fat:
Poly. Fat
0.429 g
Contains
less
Sat. Fat Saturated fat
-34%
Contains
more
Mono. Fat Monounsaturated fat
+376.9%
Contains
more
Poly. Fat Polyunsaturated fat
+75.1%