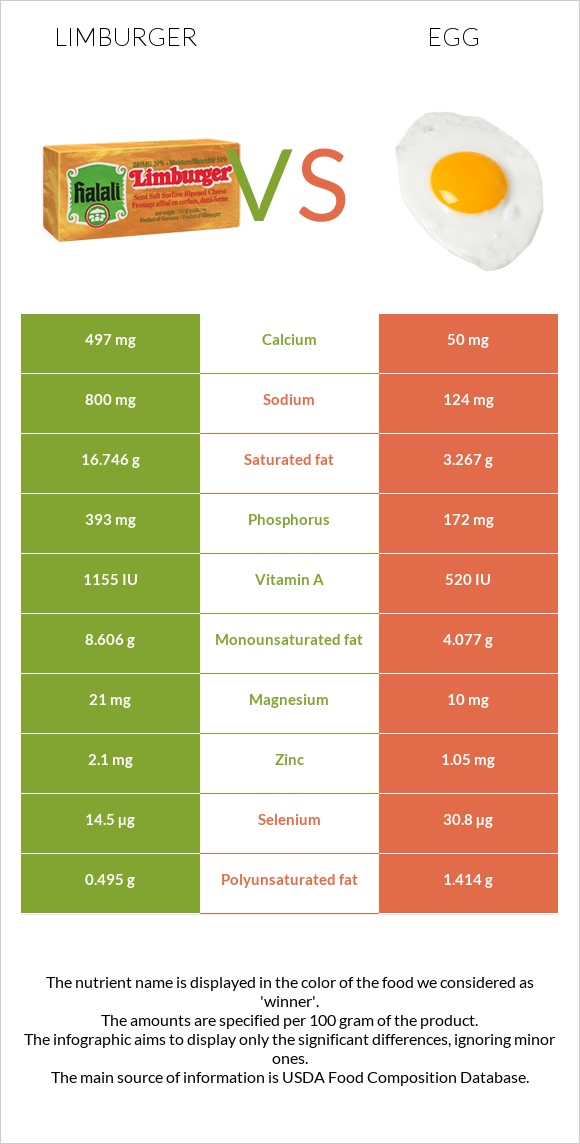
Summary of differences between Limburger and eggs Limburger has more calcium, phosphorus, and vitamin A; however, eggs are higher in copper, choline, selenium, and iron. Eggs cover your daily need for copper, 220% more than Limburger. Limburger has 10 times more calcium than eggs. While Limburger has 497mg of calcium, eggs have only 50mg. Eggs have less sodium. The glycemic index of Limburger is higher. These are the specific foods used in this comparison Cheese, limburger and Egg, whole, cooked, hard-boiled .
Infographic
Mineral Comparison
Mineral comparison score is based on the number of minerals by which one or the other food is richer. The "coverage" charts below show how much of the daily needs can be covered by 300 grams of the food.
5
100 g
300 g
1 cubic inch - 18g 1 oz - 28.35g 1 box - 113g 1 cup - 134g 1 package (8 oz) - 227g
Magnesium
Magnesium
Calcium
Calcium
Potassium
Potassium
Iron
Iron
Copper
Copper
Zinc
Zinc
Phosphorus
Phosphorus
Sodium
Sodium
Manganese
Manganese
Selenium
Selenium
15%
149%
11%
4.9%
7%
57%
168%
104%
5%
79%
4
100 g
300 g
1 tbsp - 8.5g 1 large - 50g 1 cup, chopped - 136g
Magnesium
Magnesium
Calcium
Calcium
Potassium
Potassium
Iron
Iron
Copper
Copper
Zinc
Zinc
Phosphorus
Phosphorus
Sodium
Sodium
Manganese
Manganese
Selenium
Selenium
7.1%
15%
11%
45%
667%
29%
74%
16%
3.4%
168%
Vitamin Comparison
Vitamin comparison score is based on the number of vitamins by which one or the other food is richer. The "coverage" charts below show how much of the daily needs can be covered by 300 grams of the food.
5
100 g
300 g
1 cubic inch - 18g 1 oz - 28.35g 1 box - 113g 1 cup - 134g 1 package (8 oz) - 227g
Vitamin C
Vit. C
Vitamin D
Vit. D
Vitamin A
Vit. A
Vitamin E
Vit. E
Vitamin B1
Vit. B1
Vitamin B2
Vit. B2
Vitamin B3
Vit. B3
Vitamin B5
Vit. B5
Vitamin B6
Vit. B6
Vitamin B12
Vit. B12
Vitamin K
Vit. K
Folate
Folate
0%
7.5%
113%
4.6%
20%
116%
3%
71%
20%
130%
5.8%
44%
4
100 g
300 g
1 tbsp - 8.5g 1 large - 50g 1 cup, chopped - 136g
Vitamin C
Vit. C
Vitamin D
Vit. D
Vitamin A
Vit. A
Vitamin E
Vit. E
Vitamin B1
Vit. B1
Vitamin B2
Vit. B2
Vitamin B3
Vit. B3
Vitamin B5
Vit. B5
Vitamin B6
Vit. B6
Vitamin B12
Vit. B12
Vitamin K
Vit. K
Folate
Folate
0%
33%
50%
21%
17%
118%
1.2%
84%
28%
139%
0.75%
33%
All nutrients comparison - raw data values
Nutrient
DV% diff.
Copper
0.021mg
2mg
220%
Cholesterol
90mg
373mg
94%
Saturated fat
16.746g
3.267g
61%
Choline
15.4mg
293.8mg
51%
Calcium
497mg
50mg
45%
Phosphorus
393mg
172mg
32%
Selenium
14.5µg
30.8µg
30%
Sodium
800mg
124mg
29%
Fats
27.25g
10.61g
26%
Vitamin A
340µg
149µg
21%
Protein
20.05g
12.58g
15%
Iron
0.13mg
1.19mg
13%
Monounsaturated fat
8.606g
4.077g
11%
Zinc
2.1mg
1.05mg
10%
Calories
327kcal
155kcal
9%
Vitamin D
0.5µg
2.2µg
9%
Vitamin D*
20 IU
87 IU
8%
Polyunsaturated fat
0.495g
1.414g
6%
Vitamin E
0.23mg
1.03mg
5%
Vitamin B5
1.177mg
1.398mg
4%
Folate
58µg
44µg
4%
Magnesium
21mg
10mg
3%
Vitamin B6
0.086mg
0.121mg
3%
Vitamin B12
1.04µg
1.11µg
3%
Vitamin K
2.3µg
0.3µg
2%
Manganese
0.038mg
0.026mg
1%
Vitamin B1
0.08mg
0.066mg
1%
Vitamin B2
0.503mg
0.513mg
1%
Vitamin B3
0.158mg
0.064mg
1%
Protein per 100 calories
6.1g
8.1g
N/A
Calories per 10 g protein
163kcal
123kcal
N/A
Weight per 100 calories
31g
65g
N/A
Unsaturated / Saturated Fat ratio
0.54
1.7
N/A
Net carbs
0.49g
1.12g
N/A
Carbs
0.49g
1.12g
0%
Potassium
128mg
126mg
0%
Sugar
0.49g
1.12g
N/A
Tryptophan
0.289mg
0.153mg
0%
Threonine
0.739mg
0.604mg
0%
Isoleucine
1.219mg
0.686mg
0%
Leucine
2.093mg
1.075mg
0%
Lysine
1.675mg
0.904mg
0%
Methionine
0.619mg
0.392mg
0%
Phenylalanine
1.116mg
0.668mg
0%
Valine
1.439mg
0.767mg
0%
Histidine
0.578mg
0.298mg
0%
Omega-3 - EPA
0g
0.005g
N/A
Omega-3 - DHA
0g
0.038g
N/A
Macronutrient Comparison
Macronutrient breakdown side-by-side comparison
3
20%
27%
48%
4%
Protein:
20.05 g
Fats:
27.25 g
Carbs:
0.49 g
Water:
48.42 g
Other:
3.79 g
2
13%
11%
75%
Protein:
12.58 g
Fats:
10.61 g
Carbs:
1.12 g
Water:
74.62 g
Other:
1.07 g
Contains
more
Protein Protein
+59.4%
Contains
more
Fats Fats
+156.8%
Contains
more
Other Other
+254.2%
Contains
more
Carbs Carbs
+128.6%
Contains
more
Water Water
+54.1%
Fat Type Comparison
Fat type breakdown side-by-side comparison
1
65%
33%
2%
Saturated fat:
Sat. Fat
16.746 g
Monounsaturated fat:
Mono. Fat
8.606 g
Polyunsaturated fat:
Poly. Fat
0.495 g
2
37%
47%
16%
Saturated fat:
Sat. Fat
3.267 g
Monounsaturated fat:
Mono. Fat
4.077 g
Polyunsaturated fat:
Poly. Fat
1.414 g
Contains
more
Mono. Fat Monounsaturated fat
+111.1%
Contains
less
Sat. Fat Saturated fat
-80.5%
Contains
more
Poly. Fat Polyunsaturated fat
+185.7%