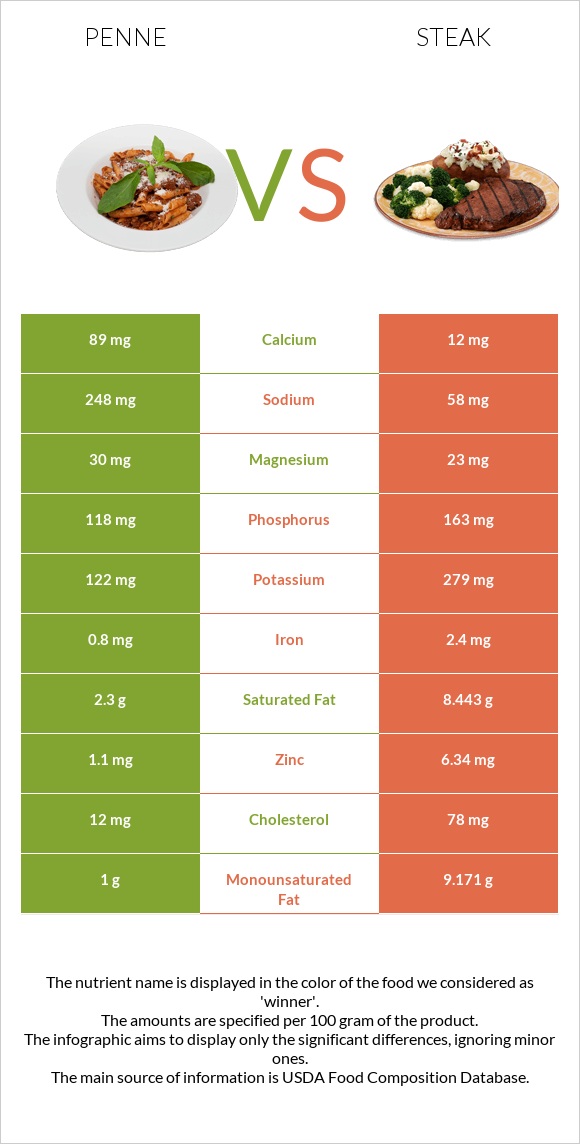
Summary of differences between penne and steak Penne has more fiber and calcium; however, steak is higher in zinc, iron, and phosphorus. Steak covers your daily need for zinc, 48% more than penne. Steak has less sodium. The glycemic index of penne is higher. These are the specific foods used in this comparison KASHI Three Cheese Penne, frozen, unprepared and Beef, rib eye steak, boneless, lip off, separable lean, and fat, trimmed to 0" fat, all grades, cooked, grilled .
Infographic
Mineral Comparison
Mineral comparison score is based on the number of minerals by which one or the other food is richer. The "coverage" charts below show how much of the daily needs can be covered by 300 grams of the food.
2
100 g
300 g
1 EntrΘe - 269g
Magnesium
Magnesium
Calcium
Calcium
Potassium
Potassium
Iron
Iron
Copper
Copper
Zinc
Zinc
Phosphorus
Phosphorus
Sodium
Sodium
Manganese
Manganese
Selenium
Selenium
21%
27%
11%
30%
0%
30%
51%
32%
0%
0%
7
100 g
300 g
3 oz - 85g 1 steak - 251g
Magnesium
Magnesium
Calcium
Calcium
Potassium
Potassium
Iron
Iron
Copper
Copper
Zinc
Zinc
Phosphorus
Phosphorus
Sodium
Sodium
Manganese
Manganese
Selenium
Selenium
16%
3.6%
25%
90%
28%
173%
70%
7.6%
0%
173%
Vitamin Comparison
Vitamin comparison score is based on the number of vitamins by which one or the other food is richer. The "coverage" charts below show how much of the daily needs can be covered by 300 grams of the food.
0
100 g
300 g
1 EntrΘe - 269g
Vitamin C
Vit. C
Vitamin D
Vit. D
Vitamin A
Vit. A
Vitamin E
Vit. E
Vitamin B1
Vit. B1
Vitamin B2
Vit. B2
Vitamin B3
Vit. B3
Vitamin B5
Vit. B5
Vitamin B6
Vit. B6
Vitamin B12
Vit. B12
Vitamin K
Vit. K
Folate
Folate
0%
0%
0%
0%
0%
0%
0%
0%
0%
0%
0%
0%
9
100 g
300 g
3 oz - 85g 1 steak - 251g
Vitamin C
Vit. C
Vitamin D
Vit. D
Vitamin A
Vit. A
Vitamin E
Vit. E
Vitamin B1
Vit. B1
Vitamin B2
Vit. B2
Vitamin B3
Vit. B3
Vitamin B5
Vit. B5
Vitamin B6
Vit. B6
Vitamin B12
Vit. B12
Vitamin K
Vit. K
Folate
Folate
0%
1.5%
2.3%
0%
19%
69%
97%
0%
115%
275%
4%
4.5%
All nutrients comparison - raw data values
Nutrient
DV% diff.
Vitamin B12
2.2µg
92%
Selenium
31.8µg
58%
Zinc
1.1mg
6.34mg
48%
Protein
5.7g
24.85g
38%
Vitamin B6
0.5mg
38%
Vitamin B3
5.149mg
32%
Saturated fat
2.3g
8.443g
28%
Fats
4g
19.02g
23%
Vitamin B2
0.301mg
23%
Cholesterol
12mg
78mg
22%
Iron
0.8mg
2.4mg
20%
Monounsaturated fat
1g
9.171g
20%
Fiber
2.7g
0g
11%
Copper
0.085mg
9%
Calcium
89mg
12mg
8%
Sodium
248mg
58mg
8%
Calories
126kcal
271kcal
7%
Carbs
16.8g
0g
6%
Phosphorus
118mg
163mg
6%
Vitamin B1
0.074mg
6%
Potassium
122mg
279mg
5%
Polyunsaturated fat
0.4g
0.896g
3%
Magnesium
30mg
23mg
2%
Folate
6µg
2%
Vitamin D*
0 IU
6 IU
1%
Vitamin D
0µg
0.1µg
1%
Vitamin A
7µg
1%
Vitamin K
1.6µg
1%
Protein per 100 calories
4.5g
9.2g
N/A
Calories per 10 g protein
221kcal
109kcal
N/A
Weight per 100 calories
79g
37g
N/A
Unsaturated / Saturated Fat ratio
0.61
1.2
N/A
Net carbs
14.1g
0g
N/A
Sugar
1.9g
0g
N/A
Trans fat
0.2g
N/A
Tryptophan
0.278mg
0%
Threonine
1.171mg
0%
Isoleucine
1.157mg
0%
Leucine
2.142mg
0%
Lysine
2.38mg
0%
Methionine
0.672mg
0%
Phenylalanine
0.997mg
0%
Valine
1.242mg
0%
Histidine
0.931mg
0%
Omega-3 - EPA
0.001g
N/A
Omega-3 - DHA
0.001g
N/A
Omega-3 - DPA
0.013g
N/A
Macronutrient Comparison
Macronutrient breakdown side-by-side comparison
3
6%
4%
17%
72%
Protein:
5.7 g
Fats:
4 g
Carbs:
16.8 g
Water:
72.4 g
Other:
1.1 g
2
25%
19%
56%
Protein:
24.85 g
Fats:
19.02 g
Carbs:
0 g
Water:
55.59 g
Other:
0.54 g
Contains
more
Carbs Carbs
+∞%
Contains
more
Water Water
+30.2%
Contains
more
Other Other
+103.7%
Contains
more
Protein Protein
+336%
Contains
more
Fats Fats
+375.5%
Fat Type Comparison
Fat type breakdown side-by-side comparison
1
62%
27%
11%
Saturated fat:
Sat. Fat
2.3 g
Monounsaturated fat:
Mono. Fat
1 g
Polyunsaturated fat:
Poly. Fat
0.4 g
2
46%
50%
5%
Saturated fat:
Sat. Fat
8.443 g
Monounsaturated fat:
Mono. Fat
9.171 g
Polyunsaturated fat:
Poly. Fat
0.896 g
Contains
less
Sat. Fat Saturated fat
-72.8%
Contains
more
Mono. Fat Monounsaturated fat
+817.1%
Contains
more
Poly. Fat Polyunsaturated fat
+124%