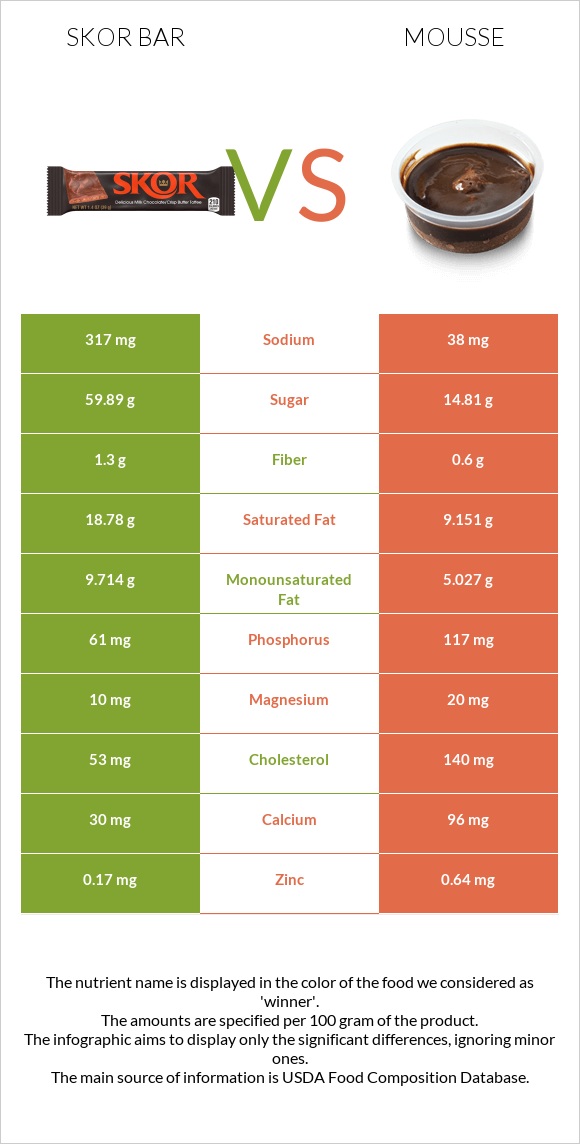
How are skor bar and mousse different? Mousse is higher than skor bar in selenium, vitamin B12, vitamin B5, vitamin B2, phosphorus, calcium, and vitamin A. Skor bar covers your daily need for saturated fat, 48% more than mousse. Skor bar contains 8 times more sodium than mousse. Skor bar contains 317mg of sodium, while mousse contains 38mg. Candies, HERSHEY'S SKOR Toffee Bar and Desserts, mousse, chocolate, prepared-from-recipe types were used in this article.
Infographic
Mineral Comparison
Mineral comparison score is based on the number of minerals by which one or the other food is richer. The "coverage" charts below show how much of the daily needs can be covered by 300 grams of the food.
0
100 g
300 g
1 bar 1.4 oz - 39g
Magnesium
Magnesium
Calcium
Calcium
Potassium
Potassium
Iron
Iron
Copper
Copper
Zinc
Zinc
Phosphorus
Phosphorus
Sodium
Sodium
Manganese
Manganese
Selenium
Selenium
7.1%
9%
14%
21%
13%
4.6%
26%
41%
0%
0%
8
100 g
300 g
0.5 cup - 202g 1 recipe yield - 808g
Magnesium
Magnesium
Calcium
Calcium
Potassium
Potassium
Iron
Iron
Copper
Copper
Zinc
Zinc
Phosphorus
Phosphorus
Sodium
Sodium
Manganese
Manganese
Selenium
Selenium
14%
29%
13%
21%
25%
17%
50%
5%
7.7%
40%
Vitamin Comparison
Vitamin comparison score is based on the number of vitamins by which one or the other food is richer. The "coverage" charts below show how much of the daily needs can be covered by 300 grams of the food.
4
100 g
300 g
1 bar 1.4 oz - 39g
Vitamin C
Vit. C
Vitamin D
Vit. D
Vitamin A
Vit. A
Vitamin E
Vit. E
Vitamin B1
Vit. B1
Vitamin B2
Vit. B2
Vitamin B3
Vit. B3
Vitamin B5
Vit. B5
Vitamin B6
Vit. B6
Vitamin B12
Vit. B12
Vitamin K
Vit. K
Folate
Folate
1.7%
1.5%
20%
12%
5%
23%
2.4%
2.4%
5.1%
26%
22%
1.5%
8
100 g
300 g
0.5 cup - 202g 1 recipe yield - 808g
Vitamin C
Vit. C
Vitamin D
Vit. D
Vitamin A
Vit. A
Vitamin E
Vit. E
Vitamin B1
Vit. B1
Vitamin B2
Vit. B2
Vitamin B3
Vit. B3
Vitamin B5
Vit. B5
Vitamin B6
Vit. B6
Vitamin B12
Vit. B12
Vitamin K
Vit. K
Folate
Folate
0.33%
0%
47%
10%
11%
47%
2.7%
32%
13%
59%
4%
11%
All nutrients comparison - raw data values
Nutrient
DV% diff.
Saturated fat
18.78g
9.151g
44%
Cholesterol
53mg
140mg
29%
Fats
30.37g
16g
22%
Calories
541kcal
225kcal
16%
Carbs
63.73g
16.07g
16%
Selenium
0µg
7.4µg
13%
Sodium
317mg
38mg
12%
Monounsaturated fat
9.714g
5.027g
12%
Vitamin B12
0.21µg
0.47µg
11%
Vitamin B5
0.04mg
0.533mg
10%
Vitamin A
61µg
140µg
9%
Phosphorus
61mg
117mg
8%
Vitamin B2
0.1mg
0.205mg
8%
Calcium
30mg
96mg
7%
Vitamin K
8.6µg
1.6µg
6%
Copper
0.04mg
0.075mg
4%
Zinc
0.17mg
0.64mg
4%
Fiber
1.3g
0.6g
3%
Manganese
0mg
0.059mg
3%
Vitamin B6
0.022mg
0.058mg
3%
Folate
2µg
15µg
3%
Protein
3.13g
4.14g
2%
Magnesium
10mg
20mg
2%
Vitamin B1
0.02mg
0.045mg
2%
Polyunsaturated fat
1.191g
0.879g
2%
Vitamin D
0.1µg
1%
Choline
3.1mg
1%
Caffeine
10mg
7mg
1%
Protein per 100 calories
0.58g
1.8g
N/A
Calories per 10 g protein
1728kcal
543kcal
N/A
Weight per 100 calories
18g
44g
N/A
Unsaturated / Saturated Fat ratio
0.58
0.65
N/A
Vitamin C
0.5mg
0.1mg
0%
Net carbs
62.43g
15.47g
N/A
Vitamin D*
3 IU
0%
Potassium
153mg
143mg
0%
Iron
0.57mg
0.55mg
0%
Sugar
59.89g
14.81g
N/A
Vitamin E
0.58mg
0.51mg
0%
Vitamin B3
0.13mg
0.146mg
0%
Omega-3 - EPA
0g
0.001g
N/A
Omega-3 - DHA
0g
0.01g
N/A
Macronutrient Comparison
Macronutrient breakdown side-by-side comparison
3
3%
30%
64%
Protein:
3.13 g
Fats:
30.37 g
Carbs:
63.73 g
Water:
1.57 g
Other:
1.2 g
2
4%
16%
16%
63%
Protein:
4.14 g
Fats:
16 g
Carbs:
16.07 g
Water:
62.94 g
Other:
0.85 g
Contains
more
Fats Fats
+89.8%
Contains
more
Carbs Carbs
+296.6%
Contains
more
Other Other
+41.2%
Contains
more
Protein Protein
+32.3%
Contains
more
Water Water
+3908.9%
Fat Type Comparison
Fat type breakdown side-by-side comparison
2
63%
33%
4%
Saturated fat:
Sat. Fat
18.78 g
Monounsaturated fat:
Mono. Fat
9.714 g
Polyunsaturated fat:
Poly. Fat
1.191 g
1
61%
33%
6%
Saturated fat:
Sat. Fat
9.151 g
Monounsaturated fat:
Mono. Fat
5.027 g
Polyunsaturated fat:
Poly. Fat
0.879 g
Contains
more
Mono. Fat Monounsaturated fat
+93.2%
Contains
more
Poly. Fat Polyunsaturated fat
+35.5%
Contains
less
Sat. Fat Saturated fat
-51.3%