Balsamic vinegar vs. White wine — In-Depth Nutrition Comparison
Compare
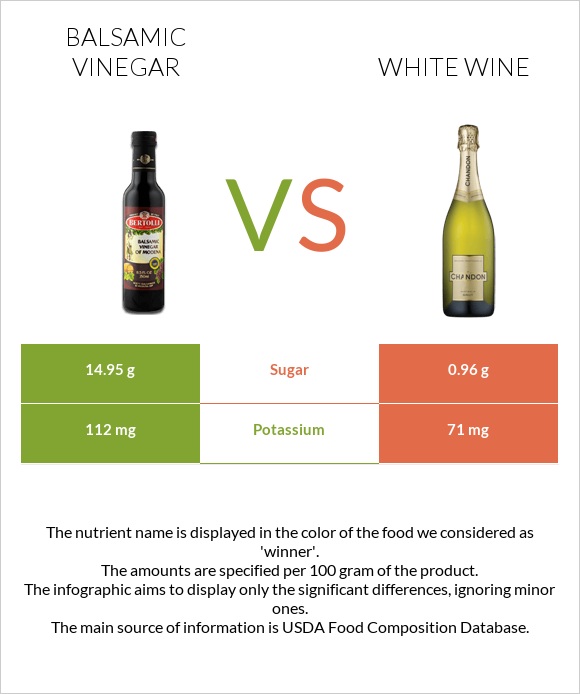
A recap on the differences between balsamic vinegar and white wine
- Balsamic vinegar is higher than white wine in iron.
- Balsamic vinegar contains 16 times more sugar than white wine. While balsamic vinegar contains 14.95g of sugar, white wine contains only 0.96g.
- The glycemic index of white wine is lower.
Food varieties used in this article are Vinegar, balsamic and Alcoholic beverage, wine, table, white.
Infographic
Infographic link
Mineral Comparison
Mineral comparison score is based on the number of minerals by which one or the other food is richer. The "coverage" charts below show how much of the daily needs can be covered by 300 grams of the food.
| Contains more MagnesiumMagnesium | +20% |
| Contains more CalciumCalcium | +200% |
| Contains more PotassiumPotassium | +57.7% |
| Contains more IronIron | +166.7% |
| Contains more CopperCopper | +550% |
| Contains more ManganeseManganese | +12% |
| Contains more ZincZinc | +50% |
| Contains less SodiumSodium | -78.3% |
Vitamin Comparison
Vitamin comparison score is based on the number of vitamins by which one or the other food is richer. The "coverage" charts below show how much of the daily needs can be covered by 300 grams of the food.
All nutrients comparison - raw data values
| Nutrient |  |
 |
DV% diff. |
| Fructose | 7.38g | 9% | |
| Iron | 0.72mg | 0.27mg | 6% |
| Carbs | 17.03g | 2.6g | 5% |
| Vitamin B6 | 0.05mg | 4% | |
| Calcium | 27mg | 9mg | 2% |
| Copper | 0.026mg | 0.004mg | 2% |
| Protein | 0.49g | 0.07g | 1% |
| Potassium | 112mg | 71mg | 1% |
| Sodium | 23mg | 5mg | 1% |
| Manganese | 0.131mg | 0.117mg | 1% |
| Vitamin B2 | 0.015mg | 1% | |
| Vitamin B3 | 0.108mg | 1% | |
| Vitamin B5 | 0.045mg | 1% | |
| Choline | 4.3mg | 1% | |
| Calories | 88kcal | 82kcal | 0% |
| Net carbs | 17.03g | 2.6g | N/A |
| Magnesium | 12mg | 10mg | 0% |
| Sugar | 14.95g | 0.96g | N/A |
| Zinc | 0.08mg | 0.12mg | 0% |
| Phosphorus | 19mg | 18mg | 0% |
| Selenium | 0.1µg | 0% | |
| Vitamin B1 | 0.005mg | 0% | |
| Vitamin K | 0.4µg | 0% | |
| Folate | 1µg | 0% |
Macronutrient Comparison
Macronutrient breakdown side-by-side comparison
Protein:
0.49 g
Fats:
0 g
Carbs:
17.03 g
Water:
76.45 g
Other:
6.03 g
Protein:
0.07 g
Fats:
0 g
Carbs:
2.6 g
Water:
86.86 g
Other:
10.47 g
| Contains more ProteinProtein | +600% |
| Contains more CarbsCarbs | +555% |
| Contains more WaterWater | +13.6% |
| Contains more OtherOther | +73.6% |
~equal in
Fats
~0g


