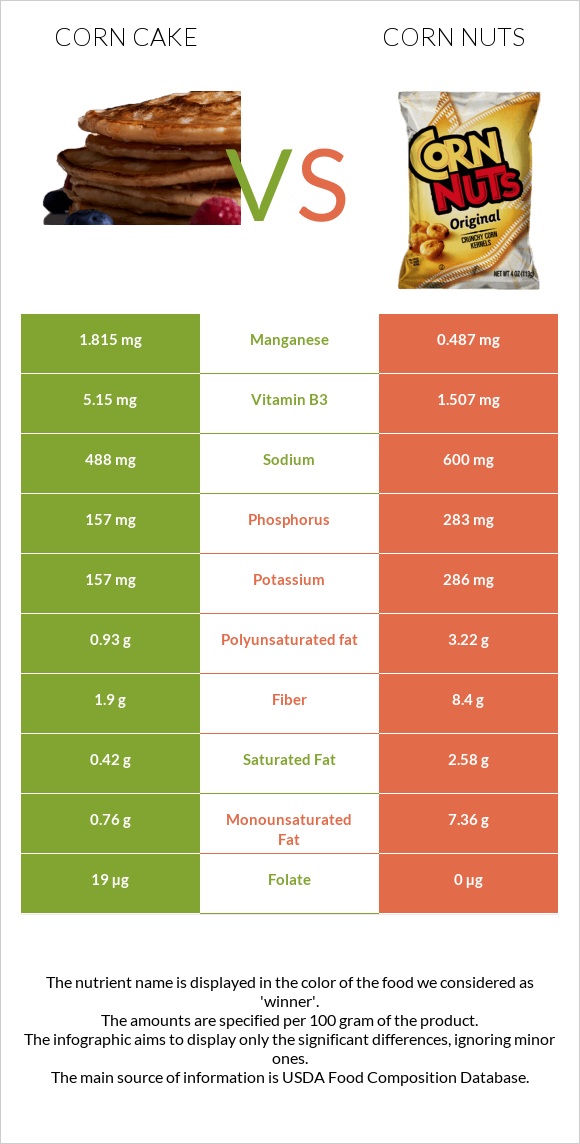
Significant differences between corn cake and corn nuts Corn cake has more manganese, copper, vitamin B3, and vitamin B5; however, corn nuts are richer in fiber, phosphorus, vitamin B1, and vitamin B2. Corn cake covers your daily manganese needs 58% more than corn nuts. Corn nuts have 3 times less vitamin B3 than corn cake. Corn cake has 5.15mg of vitamin B3, while corn nuts have 1.507mg. Corn cake contains less sodium. Corn cake has a higher glycemic index. The glycemic index of corn cake is 87, while the glycemic index of corn nuts is 40. Specific food types used in this comparison are Snacks, corn cakes and Snacks, cornnuts, barbecue-flavor .
Infographic
Mineral Comparison
Mineral comparison score is based on the number of minerals by which one or the other food is richer. The "coverage" charts below show how much of the daily needs can be covered by 300 grams of the food.
5
100 g
300 g
1 cake - 9g 2 cakes - 18g
Magnesium
Magnesium
Calcium
Calcium
Potassium
Potassium
Iron
Iron
Copper
Copper
Zinc
Zinc
Phosphorus
Phosphorus
Sodium
Sodium
Manganese
Manganese
Selenium
Selenium
81%
5.7%
14%
53%
140%
55%
67%
64%
237%
54%
3
100 g
300 g
1 oz - 28.35g 2 oz - 57g
Magnesium
Magnesium
Calcium
Calcium
Potassium
Potassium
Iron
Iron
Copper
Copper
Zinc
Zinc
Phosphorus
Phosphorus
Sodium
Sodium
Manganese
Manganese
Selenium
Selenium
78%
5.1%
25%
64%
45%
51%
121%
78%
64%
0%
Vitamin Comparison
Vitamin comparison score is based on the number of vitamins by which one or the other food is richer. The "coverage" charts below show how much of the daily needs can be covered by 300 grams of the food.
4
100 g
300 g
1 cake - 9g 2 cakes - 18g
Vitamin C
Vit. C
Vitamin D
Vit. D
Vitamin A
Vit. A
Vitamin E
Vit. E
Vitamin B1
Vit. B1
Vitamin B2
Vit. B2
Vitamin B3
Vit. B3
Vitamin B5
Vit. B5
Vitamin B6
Vit. B6
Vitamin B12
Vit. B12
Vitamin K
Vit. K
Folate
Folate
0%
0%
23%
0%
63%
12%
97%
50%
32%
0%
0%
14%
4
100 g
300 g
1 oz - 28.35g 2 oz - 57g
Vitamin C
Vit. C
Vitamin D
Vit. D
Vitamin A
Vit. A
Vitamin E
Vit. E
Vitamin B1
Vit. B1
Vitamin B2
Vit. B2
Vitamin B3
Vit. B3
Vitamin B5
Vit. B5
Vitamin B6
Vit. B6
Vitamin B12
Vit. B12
Vitamin K
Vit. K
Folate
Folate
1.3%
0%
5.7%
0%
88%
33%
28%
22%
43%
0%
0%
0%
All nutrients comparison - raw data values
Nutrient
DV% diff.
Manganese
1.815mg
0.487mg
58%
Copper
0.42mg
0.136mg
32%
Fiber
1.9g
8.4g
26%
Vitamin B3
5.15mg
1.507mg
23%
Fats
2.4g
14.3g
18%
Phosphorus
157mg
283mg
18%
Selenium
9.9µg
18%
Monounsaturated fat
0.76g
7.36g
17%
Polyunsaturated fat
0.93g
3.22g
15%
Saturated fat
0.42g
2.58g
10%
Vitamin B5
0.83mg
0.374mg
9%
Vitamin B1
0.25mg
0.35mg
8%
Vitamin B2
0.05mg
0.142mg
7%
Vitamin A
70µg
17µg
6%
Sodium
488mg
600mg
5%
Folate
19µg
0µg
5%
Carbs
83.4g
71.7g
4%
Potassium
157mg
286mg
4%
Iron
1.4mg
1.7mg
4%
Vitamin B6
0.14mg
0.187mg
4%
Calories
387kcal
436kcal
2%
Protein
8.1g
9g
2%
Magnesium
114mg
109mg
1%
Zinc
2mg
1.88mg
1%
Protein per 100 calories
2.1g
2.1g
N/A
Calories per 10 g protein
478kcal
484kcal
N/A
Weight per 100 calories
26g
23g
N/A
Unsaturated / Saturated Fat ratio
4
4.1
N/A
Vitamin C
0mg
0.4mg
0%
Net carbs
81.5g
63.3g
N/A
Calcium
19mg
17mg
0%
Sugar
23.47g
N/A
Tryptophan
0.081mg
0%
Threonine
0.301mg
0%
Isoleucine
0.316mg
0%
Leucine
0.837mg
0%
Lysine
0.267mg
0%
Methionine
0.177mg
0%
Phenylalanine
0.408mg
0%
Valine
0.442mg
0%
Histidine
0.227mg
0%
Macronutrient Comparison
Macronutrient breakdown side-by-side comparison
2
8%
2%
83%
5%
Protein:
8.1 g
Fats:
2.4 g
Carbs:
83.4 g
Water:
4.6 g
Other:
1.5 g
3
9%
14%
72%
3%
Protein:
9 g
Fats:
14.3 g
Carbs:
71.7 g
Water:
1.6 g
Other:
3.4 g
Contains
more
Carbs Carbs
+16.3%
Contains
more
Water Water
+187.5%
Contains
more
Protein Protein
+11.1%
Contains
more
Fats Fats
+495.8%
Contains
more
Other Other
+126.7%
Fat Type Comparison
Fat type breakdown side-by-side comparison
1
20%
36%
44%
Saturated fat:
Sat. Fat
0.42 g
Monounsaturated fat:
Mono. Fat
0.76 g
Polyunsaturated fat:
Poly. Fat
0.93 g
2
20%
56%
24%
Saturated fat:
Sat. Fat
2.58 g
Monounsaturated fat:
Mono. Fat
7.36 g
Polyunsaturated fat:
Poly. Fat
3.22 g
Contains
less
Sat. Fat Saturated fat
-83.7%
Contains
more
Mono. Fat Monounsaturated fat
+868.4%
Contains
more
Poly. Fat Polyunsaturated fat
+246.2%